I used to make levered bets in the option market during earnings season. Pick a direction, choose an option near the money and close to expiration, then hope. It seemed just as stupid as buying a plane ticket to Las Vegas and betting a black chip on red. By the time all expenses were weighed, I was always charged a premium for entertainment.
I have since learned a new orderbook measure that could provide an edge. It’s an idea that has been around for some time, but has plenty of room for optimization. The math is somewhat cumbersome, but I though I would take a few posts and explain why I might cancel my future trips to Vegas.
Limit Order book Information
When collecting data for an algorithmic trading system, the two most common pieces of information are quoted price, and volume. That said, it would be silly to think that information contained in the limit order book contains no excess details toward the price formation process. Not only do you know the current price, but you also know the current price that others are demanding! Creating a solid model of the order book is the key to understanding aggregate liquidity and trading interests of market participants.
Research in order books has found a significant relationship between volume, volatility, and a value known as order book slope. The ideas are somewhat nontrivial on the surface, so I want to summarize the key points and mathematics for easy implementation.
Order book Slope
If you Google around, the correlations between volume and volatility (typically denoted as the “Volume-Volatility Relation”) are used for several liquidity measures in the market. The Volume-Volatility Relation has empirical findings in stocks, bonds, currencies, and futures, though I will stick to equities in this post for demonstration.
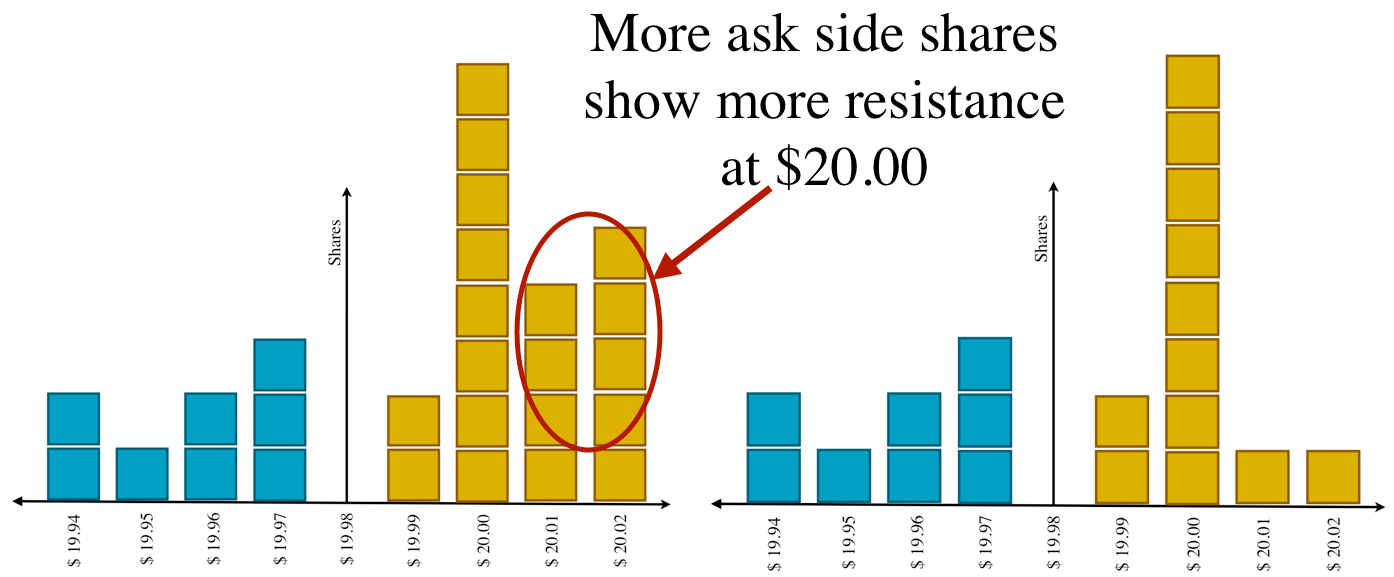
To apply Volume-Volatility to order books requires a notion of slope in a limit order book. Consider the following example.
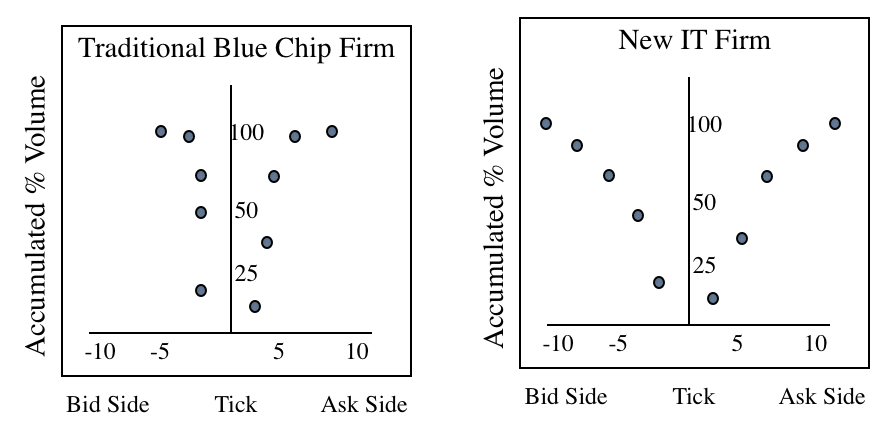
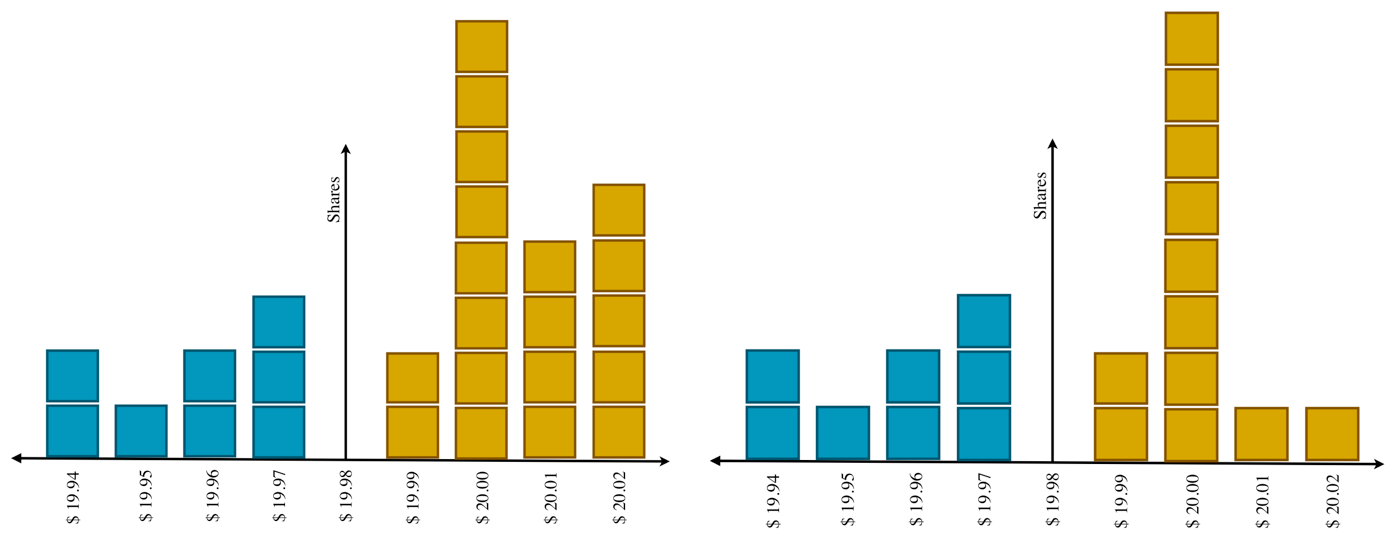
Two different types of stocks show very different slopes in their order books. The idea of a line connecting the dots intuitively explains the idea of order book slope.
In a market frozen in time, each circle in this example represents a value in the limit order book waiting to be consumed by a market order. In a simple equity market, each tick on the x-axis represents one penny movement in the stock price, while the y-axis represents the total aggregate volume on each side of the market.
The main observation you should be making is the shape of the volume in the market for these two hypothetical securities. The new IT firm seems to be more linear in creating a v-shape, while the blue chip firm has more curvature as it flattens out at the top.
The intuition is there too. Really, take a hard look at Figure 1 and think about it. Blue chip companies like Apple and Google have great volume and perhaps a tighter consensus of price during a typical day of trading. Therefore, it is reasonable to think that just about 100% of the limit order book volume occurs within 5 ticks of the current market price.
On the other hand, think about those penny stock start up companies we have all been enticed to buy at some point of our trading career. Companies with unknown valuation and future potential will have limit order book volume spread ten or more ticks from the current market price. Some people think these companies are doomed to tank as a product of price inflation, while others may own the product produced and realize the potential as early investors. The two diverse opinions will have valuations that come out drastically different and causing the plots above.
Aggregate Orderbook Slope
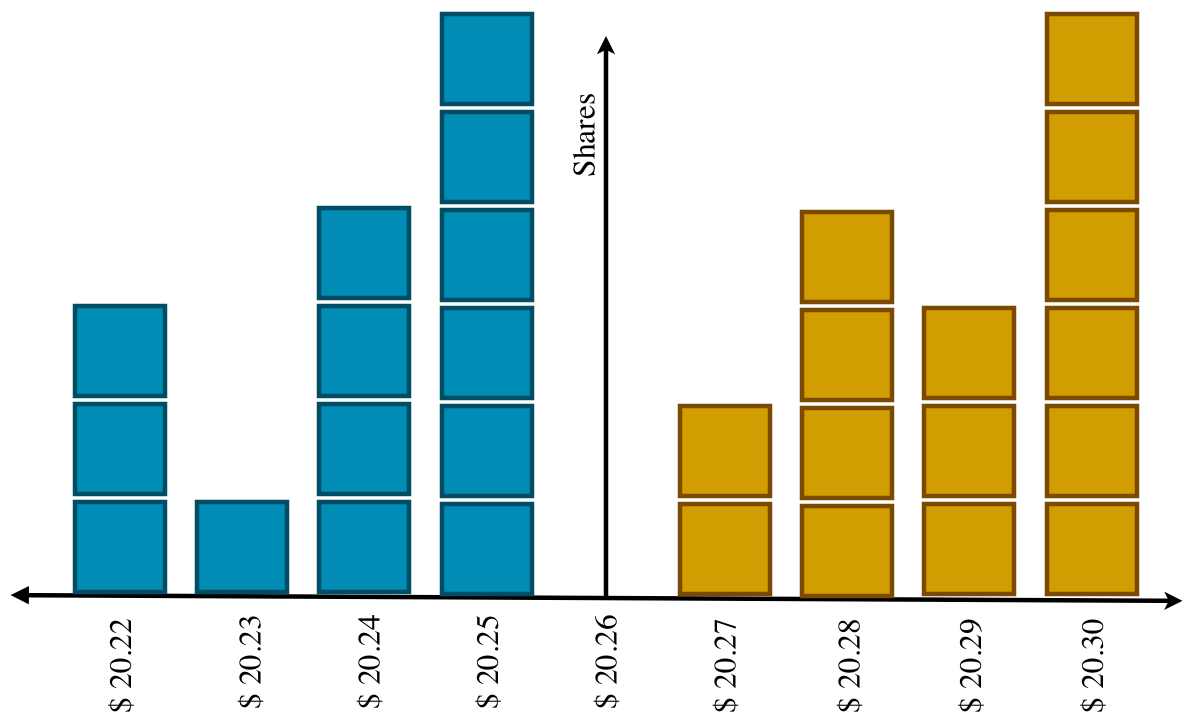
Now consider what happens over time. If you collect data over time and take an average, the result will appear as in Figure 2.

Order book slopes published by Naes and Skjeltorp
Here, about 50% of volume in the blue chip firm has limit prices within 5 ticks (left) while only 10% of volume is within 5 ticks for the young IT firm on the right.
The published research finds a negative relationship between (average) order book slope and the variation of analysts’ earnings forecasts. This means that as the slope becomes more linear (right plot of figure 2) investors disagree more about the value of the firm and thus higher volatility will likely result.
Creating a solid model of the order book is the key to understanding information about aggregate liquidity and trading interests of market participants.
In fact, the order book slope has been shown to have relation to volatility, volume, and the correlations between volume and volatility– all three of which could be profited on.
Surprisingly, in the mid 1990’s, people were studying the shapes of these curves and relating them to the different liquidity providers present in the market. The shapes were shown to find the probability of informed traders completing market orders at any given moment! See the Glosten model for more info.
Making a precise definition of order book slope requires a blog post of explanation of itself. The math looks daunting at first glance, but as I will explain later, has great intuition, elegance and simplicity. Along with that, the formulas are tangible and should leave you with a relatively simple programming problem (assuming you have the data)