Algorithmische und mechanische Forex Strategien | OneStepRemoved

  • Articles
  • Sophisticated Web Sites
  • Automated Trading
  • Erfahrungsberichte
  • Kontakt

How to Trade the GBP after Brexit

Juli 12, 2016 von Lior Alkalay 2 Kommentare

The selloff in GBP pairs after Brexit presents a challenge for a trader. At first glance, the strategy for the key GBP pairs, mainly that of the GBP/USD and GBP/JPY, should be simple. The GBP is in vertical short, falling almost in a horizontal line; Daher, the trader should apply a vertical short strategy. But when it comes to the GBP, and for that matter, any pair trading at multi-decade lows, the game plan should be slightly different. So without further ado, here are some tips to trade the GBP after Brexit and any pair that is under its historical lows.

GBP: Two Risks

In the aftermath of the GBP Brexit meltdown, GBP pairs, such as the GBP/USD, have two major risks that we have to navigate around – direction and momentum.

Direction – Since we are talking about multi-year lows, we cannot know when the bottom will emerge, because the pair is in uncharted territory.

Momentum – Again, we have no way of knowing when the momentum will change from vertical bearish movement to a trend to a possible range bound.

So how do we handle those unknowns? We use strategies that minimize the risk from the elements.

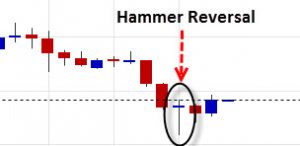
Buy on Hammer Reversal

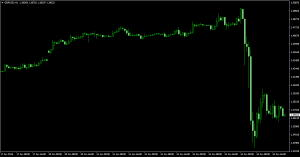
As we can see in the chart below, and as is common when a vertical short occurs, after the vertical short comes a brief bounce. What indicates that that bounce is coming is a hammer reversal candle. A hammer reversal candle is a candle where the middle is long and the opening price and closing price are very close. Once we get a hammer reversal candle we can expect a small bounce.

To increase our confidence in an upcoming bounce we can and should combine a MACD indicator. If the MACD indicator suggests weakening momentum, we get a confirmation. Once we get our confirmation it is a signal to buy; our limit should be set below the opening price of the first full bearish candle of the latest vertical short.

GBP

Why should we use this strategy? When we have no indication as to when the pair will bottom out, it’s hard to take a short without risking a sudden bounce back. Normally, it’s less advisable to trade but, under the current conditions, this pattern gives us a chance to reduce the risk of the unknown and minimize the time we are exposed to a choppy market.

Sell on a Major Pull Back

At some stage, every short, no matter how strong, gets a major pull back. That will be our first real opportunity for a short entry. Once we get a major reversal, and by major I mean at least 38.2% of a Fibonacci retracement, then we will get our opportunity to short. That’s because no bearish trend ends without at least two attempts at the same low. That means that, at such a stage, we are no longer in an unknown and our target is the pair’s lowest point.

It’s important to note that when a pair experiences a major retracement it usually signals the end of a vertical short movement and thus is a signal for us to stop using our hammer reversal strategy.

Our limit is now known, aka the low of the pair. And our signal to short can be varied, as in trading a short under any other circumstance. Oscillators such as the MACD, Average True Range and the Stochastic Oscillator can help us time the resumption of the bearish momentum and ride the bearish wave.

But what’s important to understand here is that after a major retracement, it’s much safer to start trading on a longer term and ride a bearish wave.

Abschließend

Although those insights have been implemented on the latest meltdown in GBP pairs, the tactics we learned here are not only useful for the GBP but can prepare you for the next FX pair meltdown, whether it’s the Euro pairs or the Brazilian Real pairs. What those tactics teach you is how to trade a rather risky situation with plenty of uncertainty. Sicher, it is still risky to trade a currency in a meltdown, but at least, with the tactics above, you can avoid the major pitfalls.
Abgelegt unter: Was passiert in den aktuellen Märkten? Markiert mit: Brexit, Chart-Kerzenhalter, Fibonacci, GBPUSD, Hammer, Oszillator, retracement

Flat and happy

Juni 24, 2016 von Shaun-Overton Hinterlasse einen Kommentar

This is the first financial event since 2008 that’s hit the mainstream public. Even my friends from college are talking about the Brexit on Facebook.

My Dominari system only trades during the UK evening, so I felt comfortable leaving my system on overnight. When I woke up, jedoch, I didn’t feel the same. Did you see the GBPUSD chart? Holy cow! 1,300 pips in an hour.

Brexit

GBPUSD lost more than 1,790 pips in a day from top to bottom on the Brexit.

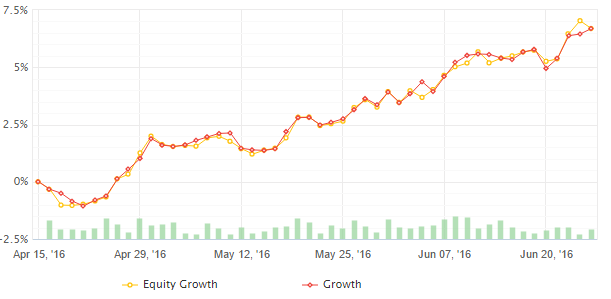
This is the first time I’ve intervened in a trading system since April of last year. What makes me very happy, Obwohl, is that this intervention is all about protecting profits. I’m up 6.69% since I began trading the finalized version of Dominari on April 15.

Dominari equity curve

My equity curve as of June 24, 2016.

myfxbook.com/members/QuantBar/dominari-pepperstone/1591822 – my results at Pepperstone

Dominari isn’t intended to trade these types of markets. Also, instead of deciding to “see what happens”, I’m flat and happy until we see how the markets open after the weekend. I expect big gaps. I don’t feel like gambling which way the gaps may go.

If you clicked the original link, you noticed that the equity curve is marching straight up. That’s what’s supposed to happen. But like any good system trader, I wanted to see it working in the real world before I upped the capital commitment.

Earlier this month, I decided to trade a second account at FXCM, this time in USD. That brings my total accounts to €8,500 and $5,100. That’s about $14,600 in USD terms between the two accounts.

The FXCM account started live trading on June 6. Before then, I made sure to test it on an FXCM demo account to confirm that my edge wasn’t completely dependent upon broker selection. I’m happy to report that the FXCM results are closely mirroring those at Pepperstone.

myfxbook.com/members/QuantBar/dominari-fxcm-mt4/1679763 – my results at FXCM.

Abgelegt unter: Herrschaft Markiert mit: Brexit, FXCM, GBPUSD, Pepperstone

QB Pro Update September 2015

Oktober 1, 2015 von Shaun-Overton 6 Kommentare

Zurück in den schwarzen Zahlen! War die Rückkehr des Monats 1.03%. Es ist kein großer Gewinn, Ich gebe, aber ein Sieg ist ein Sieg.

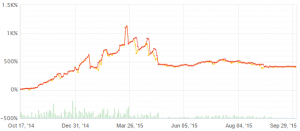
QB Pro lifetime Oct 2 2015

The lifetime equity for QB Pro

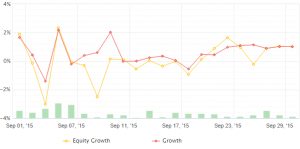
Performance didn’t really go anywhere this month. We floated 2% above and 2% below zero most of the time.

QB Pro Sept 2015 equity

The QB Pro performance for September 2015 nur

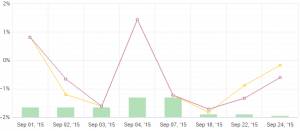
QB Yen came in again at a minor loss -0.61%.

qb yen equity 201509

The performance for QB Yen only, Sept. 2015

I’m a bit disappointed with the QB Yen performance so far. Nothing seems wrong other than bad timing turning it on on my part. It’s still hard to take it on the chin for 5 months running, Obwohl.

The hedge

I manually hedged the portfolio earlier this month by buying USDCNH in a pullback from of all the chaos. The portfolio took it hard when the yuan was loosened up. I figured that any further volatility would likely stem from USDCNH weakness.

The Chinese are actively intervening in their currency. As we all know from the GBP in the 1990s and the CHF this year, interventions work until they don’t. The main point of concern for me is the rollover cost. It is quite expensive to maintain the position.

The thing that makes me comfortable with that trade is that there is no chance of China miraculously healing. It’s in debt up to its eyeballs – everything from corporates all the way up to regional governments. And while China doesn’t want the yuan to devalue too quickly, the absolute last thing it would want is for the yuan to rise in value.

I cannot conceive of any plausible scenario where China manages to return to the 7-10% annual GDP growth that it experienced for 30 Jahre. Too hot, too fast. If you have a plausible scenario in mind, then write your ideas in the comments section.

Updates to the strategy

I’ve promised many updates to the strategy over the past 6 Monaten. Jingwei and I have evaluated them all. All of the proposed changes came up far short of my expectations and were thus not implemented in the live account.

I’m working with Jingwei, our actuary, to develop new trading systems. You’re going to learn the newest indicator in a few months.

Geschrieben von OneStepRemoved.com auf Thursday, September 17, 2015

The changes alluded to in the post are all different from QB Pro. I’ve flogged that strategy about as much as I can.

I feel good about QB Pro long term. Before anything potentially good happens in the account, jedoch, I really need the Fed to get off the bench. Raising rates would be good for us because it should kick off a long term USD trend. Another round of QE would be the best thing for the strategy. I personally despise QE and think it’s a bad idea, but it would ignite a massive USD selloff. That’s the kind of market where QB Pro has done extraordinarily well in the past.

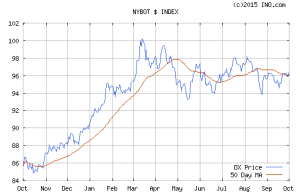
Here’s the US dollar index for the past year:

US dollar index 365 Tag

The US dollar index for the past year.

And for easy comparison, here’s the same QB Pro lifetime equity chart. Notice that performance peaked around mid-March and has been flat ever since.

QB Pro lifetime Oct 2 2015

The lifetime equity for QB Pro

Things should pick back up whenever the dollar picks a direction. I expect that to happen by year’s end. Nobody will believe the Fed if they punt one more time on a rate increase in December.

In der Zwischenzeit, all of this research has given me the great epiphany that the strategy works best where pairs are trending. The portfolio is being rebalanced this month accordingly.

Abgelegt unter: QB-Pro Markiert mit: China, eurchf, Federal Reserve, GBPUSD, Zinsen, Quantitative Easing, Yuan

Effektive Trendline Navigation

Juni 24, 2015 von Richard Krivo Hinterlasse einen Kommentar

Wie bei nahezu jedem Handel Szenario, we must first determine the direction that we need to trade the pair for the greatest likelihood of success.

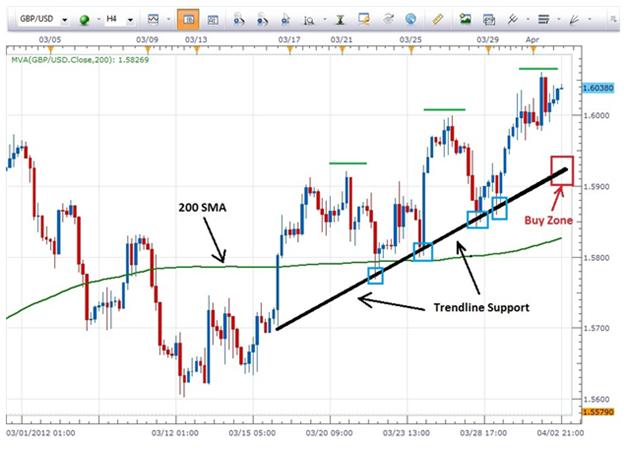
By looking at the historical 4 hour chart of the GBPUSD below, there are several reasons we know that we want to go long (kaufen) Das Paar. Price action is above the 200 Simple Moving Average and is pulling away from it. The pair has been making higher highs (green lines) and higher lows which indicates an uptrend. Auch, at the time of this chart, the GBP was die strongest currency and the USD was one of the weaker currencies.

All these point to a buying opportunity.

Aber, the question remains, when do we enter the trade?

Here’s where we bring in the trendline…

Screen Shot 2013-06-24 bei 2.58.57 PM

Let’s take a look at the historical 4 hour chart of the GBPUSD pair below…
Trendlinie 1


We can see that price action has come in contact with trendline support at several points – note the blue boxes.

Since price has tested and respected the trendline for at least three “touches”, we know that our trendline is valid.

Our entry strategy to buy this pair using trendline support will be to wait for price to trade down to the trendline and into the “Buy Zone”. If price trades into the Buy Zone and stalls and a candle does not close below trendline support, just as in our blue box examples, we can take a long position on the pair with our stop just below the trendline or just below the lowest wick that penetrates the trendline.

The trader could exit the trade if price reaches resistance, the previous high, or by employing a simple 1:2 Risk Reward Ratio.

Now let’s take a look at a historical 4 hour chart of the USDCHF for an example of selling against Trendline Resistance in a downtrend…

Trendlinie 2

This trading scenario will be virtually the opposite of what we did in the previous buy example.

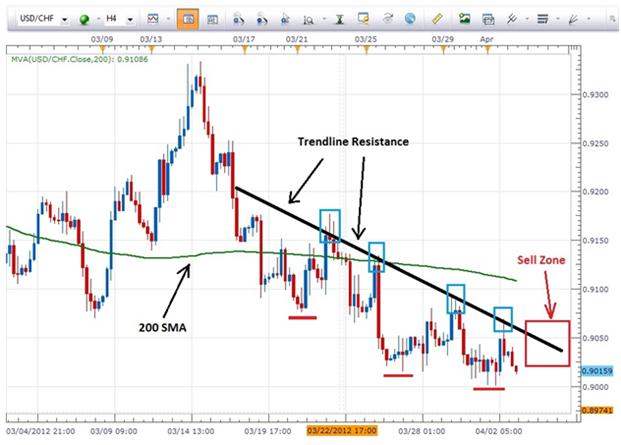
We want to sell the pair a it has been making lower lows (red lines) and lower highs. Price action is below the 200 SMA and pulling away from it. Auch, at the time of this chart, the USD was weak and the CHF was strong.

Wieder, price action has tested our resistance line at several points (the blue boxes) so we know the trendline to be valid. In this example we would wait for price to trade up to trendline resistance in the “Sell Zone”. As long as a candle does not close above the trendline, we would sell the pair with a stop just above the trendline or just above the highest wick to penetrate the trendline.

The trade could be closed should price reach the previous low or we could use a 1:2 Risk Reward Ratio to exit the trade.


RKrivoFX@gmail.com

@RKrivoFX

Abgelegt unter: Wie funktioniert der Forex-Markt? Markiert mit: determining trend direction, GBPUSD, Risiko-Ertrags-Verhältnis, Trend, Trendlinie, USD/CHF

Börsenhändler EA andere Paare

März 26, 2013 von Shaun-Overton Hinterlasse einen Kommentar

Eine Reihe von Lesern sind unter Verwendung der Börsenhändler EA in live-Konten. Die Nummer eine Frage, die viele von ihnen zitiert ist, dass meine Forschung ausschließlich auf den EURUSD spezialisiert. Funktioniert es auf anderen Forexpaare?

Absolut. Jedoch, Es funktioniert nicht auf allen von Ihnen. Es ist wichtig, den gleichen logischen Prozess zu folgen, der erklärt, warum die Fachberaterin funktioniert so gut auf den EURUSD.

Analysieren der Scalper EA in Excel-Diagrammen

Wir müssen wieder in Excel auswerten die ursprüngliche Hypothese Tauchen.. Meine Erwartung war, dass die Strategie auf Charts funktionieren sollte wo die Entfernung des Preises von der 200 SMA bildet eine schöne Flexion zur Halbzeit der Kurve.

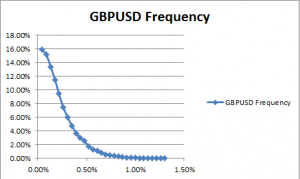
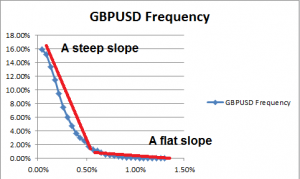
GPBUSD price & SMA 200 distance frequency for the scalper EA

Die Häufigkeit der verschiedenen Entfernungen des Preises von der 200 SMA auf GBPUSD.

Der Bereich direkt um die 0.5% markiert den Wendepunkt. Als Erinnerung, Man kann die Kurve als aus zwei Teilen. Es ist der steile Teil, welches ist, wo der Preis ist sehr wahrscheinlich verschieben. Dann gibt es der flache Teil. Das bedeutet, dass statt bewegt sich der Preis treibt.

Denken Sie an Hang als Änderungsrate. Ein steiler Hang bedeutet hohem Tempo des Wandels. Der Preis ist wahrscheinlich irgendwo anders als hier auf die nächste bar.

Flache Pisten sorgen für langsame Veränderungsraten. Der Preis ist in der Tat sehr wahrscheinlich in Zukunft weiterhin eine ähnliche Entfernung der SMA Takte.

Slope of frequency of price and SMA 200 distances.

Das Diagramm enthält 2 Pisten. Einen steilen Hang und einem flachen Hang. Beide sind rot markiert.

Die Strategie funktioniert nur, wenn der Preis an der gleichen Stelle bleiben dürfte. Wir sind, Letztendlich, Skalpieren. Die Möglichkeit besteht nur, wenn die Fachberaterin in die Chop handeln können. Der Hacken ist nur vorhanden, wenn die Steigung der Linie Frequenz flach ist.

Ich habe meine Erfahrung auf den EURUSD abzuleiten, die 0.75% wäre für einen natürlichen Ausgangspunkt für die gleitenden Mittelwert Hülle auswerten. Es hat weit genug von den Wendepunkt zur Überwindung Kosten verbreitet, aber nahe genug, um eine feste Anzahl von Handelsmöglichkeiten Ausbeute.

Die ersten Ergebnisse herauskam noch besser als die EURUSD. Diese Ergebnisse umfassen nicht verrutschen, Provisionen oder Ausbreitung Kosten.

GBPUSD Ergebnisse

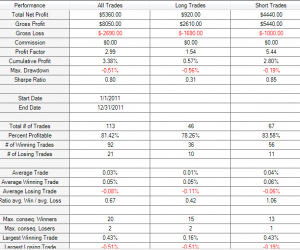
Ergebnisse für 2011 for the scalper EA on GBPUSD

Ergebnisse für 2011 for the scalper EA on GBPUSD

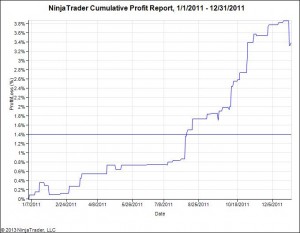
Die Ergebnisse sind weitgehend im Einklang mit der ursprünglichen Idee. Prozent Genauigkeit blieb in der gleichen ballpark, herauskommen, um 81%. Der Gewinn-Faktor sprang sehr schön zu 2.99, Das ist deutlich besser als die EURUSD-Leistung der 2.16. Die Stichprobengröße besteht aus 113 Facharbeit, Das ist genug, um eine vernünftige Erwartung der Leistung ableiten.

Equity curve of the scalper EA on GBPUSD for 2011.

Equity curve of the scalper EA on GBPUSD for 2011.

Der letzte Test ist “macht es Geld, wenn darunter Handelskosten?” Die Antwort ist ja. Auf eine 2.5 PIP-spread, die Handelskosten Norm lose auf insgesamt 113 Handwerk ist $25/Menge * 113 viele (Facharbeit) = $2,825. Diese Zahl ist deutlich weniger als die rohen Gewinn von $5,360. Es ist sinnvoll, diese Strategie zu handeln.

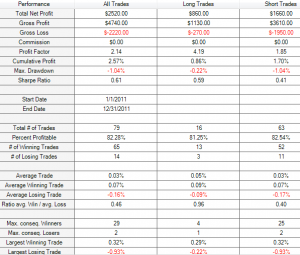
Der letzte Schritt des Gehens bieten nicht genügend Datenpunkte, um eine Schlussfolgerung ziehen vorwärts leider. Es nur in Verkehr gebracht 13 Trades für das ganze Jahr. Es brach sogar.

USDCAD scalping Statistiken

EA scalper, USDCAD, 0.9% banwidth

Leistung für USDCAD 2011 mit einer Bandbreite von 0.9%.

Equity-Kurve des USDCAD für 2011, EA Scalper

Equity-Kurve des USDCAD für 2011

USD/JPY ist eine schlechte Idee

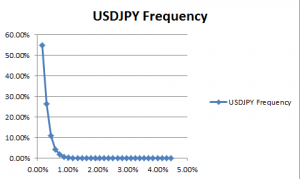
Das Frequenz-Diagramm für die USDJPY sieht viel, ganz anders als die anderen Währungen. Statt einer steilen und überwiegend flach, Es ist mehr wie frei fallende und perfekt flach. Die massive Größe des Schwanzes und der schwere Kontrast zwischen dem steilen und flachen Bereich führte mich zu der Annahme, richtig, USD/JPY-Handel keine gute Idee wäre.

Die Häufigkeit der verschiedenen Entfernungen des Preises von der 200 SMA auf USD/JPY.

Die Häufigkeit der verschiedenen Entfernungen des Preises von der 200 SMA auf USD/JPY.

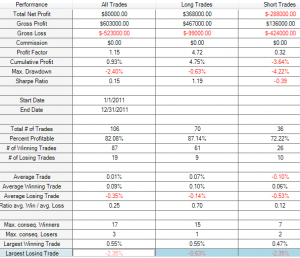
Obwohl die Gebiete in der Nähe der Wendepunkt tatsächlich profitabelsten sind, der Gewinn-Faktor für USDJPY stürzt leicht oben 1.0. Wann Handelskosten berücksichtigt werden, Es macht keinen Sinn zu handeln.

Scalper EA USDJPY 2011

Leistung für die Börsenhändler EA für USDJPY Handel in 2011

Mit Bezug

Haben Sie lesen den Artikel erläutert, wie und warum die Börsenhändler EA Werke?

Wenn Sie Vorschläge, wie haben man die Regeln gelten für weitere Währungspaare oder Instrumente zu machen, dann teilen Sie bitte in den Bemerkungen weiter unten.

Abgelegt unter: Trading Strategie-Ideen Markiert mit: EUR/USD, Fachberaterin, GBPUSD, Börsenhändler, Skalpieren, USDCAD, USD/JPY

Kostenlose trading-Strategien per e-Mail

Trendanalyse

Tut mir Leid. No data so far.

Archiv

  • Herrschaft
  • Wie funktioniert der Forex-Markt?
  • Indikatoren
  • MetaTrader-Tipps
  • MQL (für nerds)
  • NinjaTrader Tipps
  • Pilum
  • QB-Pro
  • Stop, Geld zu verlieren
  • Testen Sie Ihre Konzepte historisch
  • Trading Strategie-Ideen
  • Allgemein
  • What's happening in the current markets?

Übersetzung

EnglishEnglish
中文(简体)中文(简体)
DeutschDeutsch
日本語日本語
Bahasa MelayuBahasa Melayu
PortuguêsPortuguês
EspañolEspañol
von Transposh - Übersetzungs-Plug-In für WordPress

Kostenlose Trading-Strategien

DatenschutzRisk Disclosure

Copyright © 2019 OneStepRemoved.com, Inc. Alle Rechte vorbehalten.