アルゴリズムと機械の外国為替戦略 | OneStepRemoved

  • Articles
  • Sophisticated Web Sites
  • Automated Trading
  • お客様の声
  • お問い合わせ

取引外国為替のペアで共和分

4 月 23, 2014 によって エディ ・花 21 コメント

取引外国為替のペアで共和分は貴重なツール. 私にとって, 共和は優れたマーケット ニュートラル機械的取引戦略は、どのような経済環境で利益を得ることができますのための基礎. かどうか、市場は上昇基調です。, 下降または横に移動するだけ, 外国為替ペアの取引利益を一年中収穫することができます。.

統計的裁定取引とを意味する帰属に基づく共和分を利用して取引戦略が収束取引の一形態として分類される外国為替対. 戦略のこのタイプは 1980 年代にモルガン ・ スタンレーの定量的トレーディング チームによって最初に大衆化される株式のペアを使用して, 私は、他のトレーダーが取引外国為替のペアに対しても非常によく機能を見つけたが, あまりにも.

共和に基づく取引外国為替対

取引外国為替のペア共和分に基づいて基本的に返還-意味の戦略は、します。. 端的に言えば, 場合 2 つ以上の通貨ペア、共和分, それは別の為替ペアのスプレッド価格が時間をかけて一貫してその平均値に戻す傾向があることを意味します。.

その共和は、相関ではない理解することが重要です。. 相関関係は価格の動きの関連について短期的な関係. 相関個々 の価格が一緒に移動することを意味します。. ただし、一部のトレーダーによって相関に依存, それ自体では信頼できないツールです。.

反対に, 共和分の価格の動きの関連と長期的な関係であります。, 価格移動する一緒にまだ特定の範囲またはスプレッド内, まるで一緒につな. 共和分取引外国為替ペアで非常に有用なツールであることを発見しました。.

私の forex の通貨ペアが取引中に, 普及が私の機械取引アルゴリズムによって計算されたしきい値値を広げるとき, 「短い」ペアの価格間の広がり. 他の言葉で, 私は賭けている、共和のためゼロに向かって広がりが戻ります.

基本的な通貨ペアの取引戦略は非常に簡単, 特に機械的な取引システムを使用する場合: 同様に移動する傾向がある 2 つの異なる通貨ペアを選択してください。. アウト パフォーマンスのペアの下で実行する通貨ペアを購入、売買. 2 つのペアのスプレッドが収束するとき, 私は私の利益のための位置を閉じる.

取引外国為替のペアに基づいて共和分かなり市場中立戦略は、します。. 例として, 場合は、通貨ペアの急落, その貿易はおそらく損長辺と短辺益の相殺が表示されます。. だから, しない限り、値を突然失うすべての通貨と原資, ネット トレードが最悪のシナリオでゼロに近いする必要があります。.

同じトークンで, 多くの市場での取引のペアは自己資金調達取引戦略です。, 短い販売からの収入は、ロング ポジションを開く場合にも使用できますので. この特典がなくても, 共和分燃料の外国為替のペア取引まだ動作非常によく.

共和分の取引外国為替のペアを理解

共和は平衡の価格だけでなく、長期的な価格の期待から両方の短期的な偏差に基づく私機械的な取引システムをプログラムできるため取引外国為替ペアで私にとって有用です。, 修正というか平衡に戻ると.

どのように共和分駆動外国為替ペア作品を取引を理解するには, まず共和分を定義し、どのようにそれは機械的な取引システムの機能を記述することが重要です。.

上記述べたよう, 共和分と時系列のセット間の均衡関係は、します。, 自分で平衡にない別の為替ペアの価格など. 数学的な用語で記載されています。, 共和は時系列の非定常変数間の関係を測定するための手法.

2 つ以上の時間シリーズ各ルートの値に等しい場合、 1, 線形組合せはある静止したが、, その後、彼らは言われる共和分.

簡単な例として, 株式市場の索引とその関連の先物契約の価格を検討します。: これらの 2 つの楽器のそれぞれの価格は、時間の短い期間にわたってランダムに迷うことがありますが, 最終的に彼らは平衡に戻ります, その偏差が静止して.

ここでは、別のイラスト, 古典的な「ランダム ・ ウォーク」例の観点から説明: 家路を歩いて大騒ぎの夜の後 2 つの個々 の酔っぱらいがあるとしましょう. さらにこれら 2 つの酔っぱらいは、お互い知らない仮定します。, だから間がない予測可能な関係、個々 の経路. したがって, 彼らの動きの間の共和はありません。.

対照的に, ひもにつないで彼の犬に同行しながら個々 の飲酒は家路放浪のアイデアを検討します。. この場合, これらの 2 つの貧しい生き物の経路の間に明確な接続があります。.

時間の短い期間でまだ個々 の経路にはそれぞれ 2 つの, かかわらずペアの 1 つはランダムにつながる可能性がありますまたは時間で任意の時点で他のラグ, まだ, 彼らは常に近くに発見します。. それらの間の距離はかなり予測可能です, こうしてペアはある共和分といいます.

今専門用語に戻る, 2 つの非定常時系列がある場合, 通貨ペア AB と XY の仮説設定など, それらの間の違いを計算するときに固定になります。, これらの組は一次一連の統合と呼ばれる-また、私を呼び出す(1) シリーズ.

でも、どちらの系列は一定値のまま, AB とは静止して XY の線形結合がある場合 (私として記載されています。(0)), その後、AB と XY、共和分.

上記の簡単な例は仮説的な外国為替のペアの 2 つだけ時系列で構成されています. まだ, 共和分という概念は、複数の時系列にも適用されます。, 高い統合注文を使用して.いくつかの犬を伴って放浪飲酒を考える, 長さの異なる鎖の各.

実世界経済, 共和分のペアの例を見つけることは簡単です。: 収入および支出, 刑事法の厳しさ、刑務所人口のサイズまたは. 取引外国為替のペアで, 私の焦点は通貨の共和分ペアの定量的かつ予測可能な関係を生かし、します。.

たとえば, これらの 2 つの共和分仮説的な通貨ペアを見ていることと仮定します。, AB と XY, 共和分の関係は AB と – XY = Z, z がゼロ平均定常シリーズ, それは私(0).

単純な取引戦略を示唆しているようにも見えます: とき AB-XY > V, V は私のしきい値トリガー価格と, 取引システム外国為替ペアだろう AB を販売し、XY を購入し、, 価格が低下する AB と増加する XY の期待になるので. または, とき AB-XY < -V, AB を購入し、XY の販売になると思います.

取引外国為替のペアでスプリアスの退行を回避します。

まだ, 上記の例が示唆するように簡単ではありません。. 実習では, AB と XY の二乗の値に依存するだけではなく共和分を計算する必要がありますを取引外国為替ペアの機械的な取引システム.

非定常変数を扱う場合、通常回帰分析が足りないからです。. いわゆる偽退縮を引き起こすそれ, いずれかがない場合でも変数間の関係を示唆しています。.

仮定します, たとえば, 私が復帰します。 2 お互いに独立した「ランダム ・ ウォーク」時系列. 線形関係があるかどうかをテスト, 非常に頻繁に私は R 2乗し同様低 p 値の高い値を見つける. まだ, これらの間に関係がないです。 2 ランダムウォーク.

数式および共和分取引外国為替のペアでのテスト

共和分の簡単なテストはエングル グレンジャー テストです。, このような作品:

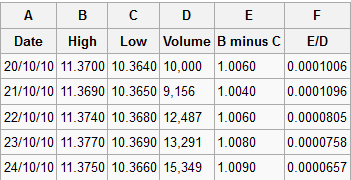
  • 確認その ABt XYt 両方の私は、(1)
  • 共和分の関係を計算します。 [XYt aAB =t + et] 最小二乗法を使用して
  • 確認共和分残差 et 単位根検定のような拡張ディッキー ・ フラーを用いて静止しています。 (自動原稿送り装置) テスト

詳細・ グレンジャー方程式:

ΔABt Α 1 を =(XYt 1 − ΒABt 1) +ut ・ ΔXYt Α 2 =(XYt 1 − ΒABt 1) + vt

とき XYt 1 − ΒABt 1 〜 私(0) 共和分の関係を説明します.

XYt 1 − ΒABt 1 長期的な不均衡の程度を説明します, α は速度と方向で通貨ペアの時系列は不均衡から自体を修正.

取引外国為替のペアでエングル グレンジャー メソッドを使用します。, 回帰のベータ値を使用して、ペアの貿易のサイズを計算します。.

取引外国為替のペアでエングル グレンジャー メソッドを使用します。, 回帰のベータ値を使用して、ペアの貿易のサイズを計算します。.

取引外国為替のペアで共和分の訂正:

取引外国為替のペアの共和分を使用する場合, また、アカウントに便利ですどの共和分変数の調整し、長期均衡に戻る. だから, たとえば, ここでは、autoregressively を示す 2 つのサンプル外国為替ペアの時間シリーズです。:

ABt aAB =t 1 + bXYt 1 + ut XYt cAB を =t 1 + dXYt 1 + vt

共和に基づく取引外国為替対

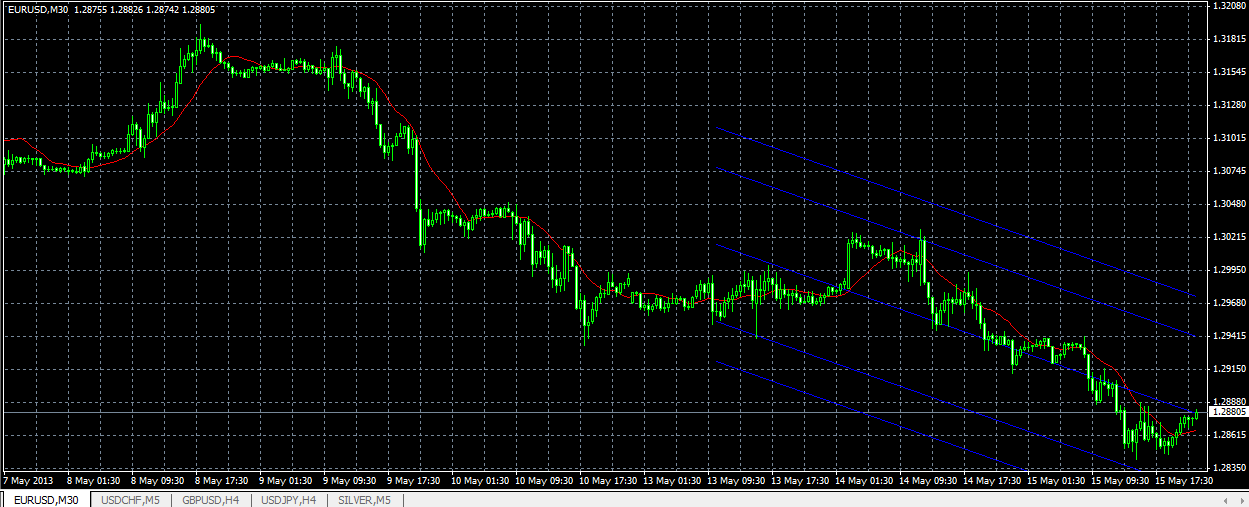
取引外国為替のペアの私機械的な取引システムを使用するとき, セットアップと実行が簡単. 最初, 私は彼らが cointegrated 可能性がありますように見える 2 つの通貨ペアを見つける, ユーロ/米ドル、ポンド/ドルなど.

その後、, 2 つのペア スプレッドの推定を計算します。. 次, 私は単位根検定または別の一般的な方法を使用して定常性をチェックします。.

私のフィードの受信データが適切に動作していることをことを確認します。, 売買のシグナルを作成私の機械取引アルゴリズム. パラメーターを確認する十分なバックテストを実行したと仮定すると, 私は最終的に私の forex の通貨ペアが取引に共和分を使用する準備.

共和分外国為替取引システムのペアを構築するための優れた出発点を提供していますメタト レーダーのインジケーターを発見しました。. ボリンジャー バンドのインジケーターのようです。, まだ実際に発振器価格を示しています 2 つの異なる通貨ペアを差.

この発振器が近づき高または低のいずれかの極端な, それはペアのデカップリングを示します, 貿易を信号します。.

まだ, 確かに成功の私は適切な取引を実行する前に拡張ディッキー ・ フラー テスト信号をフィルター処理に私の良く造られた機械トレーディング システムに依存してください。.

もちろんです, 共和は、彼または彼女の通貨ペアを取引したい人, まだ必要なアルゴリズム プログラミングのスキルを欠いています。, 専門家アドバイザーの勝利を作成する経験豊富なプログラマに頼ることができます。.

アルゴリズム取引の魔法を使って, 私は私のデータ解析に基づく価格スプレッドを定義する機械的な取引システムをプログラムします。. 私のアルゴリズムのモニター価格の偏差の, その後、自動的に購入し、市場の非効率性を収穫するために通貨ペアを販売しています。.

取引ペア外国為替と共和分を使用してとき注意すべきリスク

取引外国為替のペアではない完全リスクフリー. 上記のすべて, 共和分を使用して取引外国為替のペアは、平均回帰戦略を留めてください。, 平均値が同じであること、将来的に彼らは過去にあったと仮定に基づいています。.

ディッキー ・ フラーの拡張テストが述べられる以前の取引外国為替のペア共和分の関係を検証するに便利です。, それはスプレッドがある共和分、将来的にし続けることを意味しません。.

私は強力なリスク管理規則に依存します。, 場合、または計算された平均に返還が無効になる不採算取引から私機械的な取引システムが終了することを意味します。.

平均値が変更された場合, ドリフトという. 私は、できるだけ早くドリフトを検出しよう. 他の言葉で, 以前共和分外国為替のペアの価格は以前計算意味に戻すことがなく傾向に移動を開始する場合, 私の値を再計算する機械的な取引システムのアルゴリズムの時間です。.

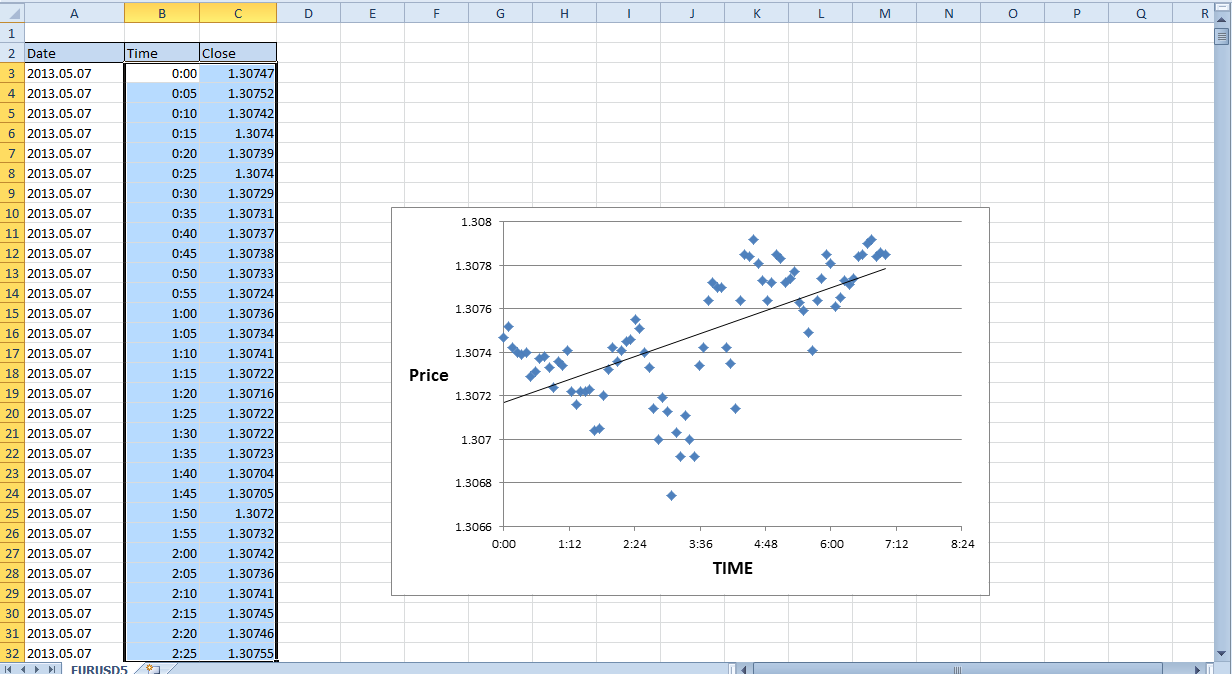
取引外国為替のペアの私機械的な取引システムを使用するとき, 普及を予測するための移動平均を計算するためにこの資料で前述した回帰式を使用してください。. その後、, 私の計算エラーの範囲で取引を終了します。.

共和は貴重なツールの私の外国為替のペア取引

取引の戦略私ができるあらゆる市場環境で貿易市場中立型機械は、取引外国為替のペアで共和分を使用して. それは意味する返還に基づくスマート戦略です。, まだ他の返還の平均外国為替取引戦略のいくつかの落とし穴を避けるため私を助ける.

収益性の高い機械的な取引システムでの潜在的な使用のため, 共和分の取引外国為替のペアは、学術研究者と同様、両方のプロのトレーダーからの関心を集めています。.

最近公開された記事がたくさん, など、 これ クオンツに焦点を当てたブログ記事, またはこれ 学術的な議論 被写体の, 十分なだけでなく、 ディスカッション トレーダーの間で.

共和は私の外国為替のペア取引で貴重なツール, 私は非常にあなた自身のためにそれを調べることをお勧めします.


以下の下でファイルさ: 外国為替市場のしくみ?, 未分類 タグが付いて: 共和分, 共和分計算, 取引通貨ペア, 機械取引

Pairs Trading – Entry Point Confirmation Using Technical Indicators

5 月 23, 2013 によって ルパートにより Leave a Comment

Trading pairs without adequate confirmation is like building a house without a structural engineer. In the short term the design may be stable and safe, however over a longer period of time, the sensitivity to weather conditions and other factors could be hazardous.

Systems that are based on one factor alone will invariably have a shelf life and will need to be retrained to accommodate shifts in market conditions. As discussed in our previous article on 共和分, the degree to which a trader does not adhere to these strict guidelines, can greatly affect his/her profitability.

Technical indicators for entry signals on a pairs trade

Some of the key technical indicators and patterns that can work well for confirming エントリ信号 include the Relative Strength Index (RSI), Market Facilitation Index (MFI) and Candlestick charting. Each has a unique attribute, and can assist in defining key entry and exit points.

相対力指数 (RSI)

Although this is a relatively common indicator that does not stand the test of time by itself, the RSI can be an effective tool in pairs trading. Defined as the change in momentum, this technical indicator will range from 100 (extremely overbought) 宛先 0 (extremely oversold). Traditionally the trigger points are 70 for a short and 30 長い間. With respect to pairs trading, this strength index allows the trader to confirm overbought and oversold scenarios.

RSI technical indicator

RSI shows how a technical indicator can be used to spot entry opportunities

  • 例:

The sppread between Gold and Silver is considerable, with the cointegration still above the required 80 マーク (according to catalyst corner). The relative strength index has confirmed that silver is trading in the oversold bracket (で 75), providing the trader with a valid entry for a short position.

Market Facilitation Index (MFI)

Invented by technical analyst Bill Williams, the MFI identifies the momentum of a movement based on the volume. Depending on the strength of the buying and selling pressure, the indicator will price in an estimate of whether the trend is strong or weak.

Commonly used with longer time frames, the Market Facilitation Index is calculated by using the high, low and volume bars. Unlike RSI, the indicator is represented by a bar graph with coloration. Green highlights strong volume and momentum, whilst blue, brown and light brown indicate indecisive volume reactions. In pairs trading, the MFI can identify long term momentum patterns and which cross to buy or short.

Included below is a table from Wikipedia, which visually highlights the degree to which an adjust in volume can influence the market facilitation index.

The money flow index shows stuff

The money flow index uses basic bar information to create a colored graph

ソース: Wikipedia,2013

  • 例:

Gold has crossed below silver on a 線形回帰 基礎. The Market Facilitation Index however has indicated that volume and momentum are rising, and there will be a rebound in the price. The trader would look at going long gold and short silver.

Candlesticks

Candlesticks are an extremely efficient way of determining the trend of a price. Different patterns defined by the open high low and close price can supply the trader with efficient entry and exit points. From a pairs trading point of view, it is important to only open a position based on a strong buy or sell pattern. Bullish signals include a piercing pattern, inverted hammer, morning star and abandoned baby. For more information on each of these patterns it is recommended to visit www.stockcharts.com

  • 例:

During the month of April, the spread between Gold and Silver is relatively tight. A morning star formation appears on the Gold price, indicating a potential bullish reversal. The trader in this case, would open a Long Gold, Short Silver to capitalize on a sudden breakout in the price.

以下の下でファイルさ: 戦略の取引のアイデア タグが付いて: candlestick charting, 共和分, market facilitation index, pairs trading, RSI

ペア取引事例: ゴールド / シルバー

5 月 20, 2013 によって ルパートにより 3 コメント

Finding a pair of currencies or commodities that can stand up to the cointegration test on both a short term and long term basis can be quite difficult. It is common for pairings to have some degree of distance or long term deviation away from the linear regression and this can greatly affect performance.

Several high profile market neutral hedge funds have been victim to this regression breakout. Long Term Capital Management (LTCM) is the most famous example. The fund lost several billion dollars in 1998 during the Russian financial crisis. Nearly every position in its bonds and derivative pairings went off the rails all at the same time.

Trading pairs is not full proof and strict risk management and cointegration retraining must be implemented. As discussed in our previous posts on correlation and cointegration, we are looking for the degree to which two variables will return to their common mean. This will determine our entry and exit strategy, and where we will place our stops.

In one of our previous articles – ‘Analysing Pairs with Correlation and Cointegration’, we identified Gold and Silver as a good potential trading pair due to its statistically high long term percentage levels. We calculated the 共和分 using a free tool from the website – Catalyst Corner www.catalystcorner.com.

Download the tools for MetaTrader 4.

30 Day Correlation: 94.98%
2 Year Correlation: 26.99%
13 Year Correlation: 95.3%
2 Year Cointegration: 85%

Pairs trading with silver and gold

シルバー (Black) ゴールド (Orange Green) 30 Minute Chart

Setting up Charts

Setting up a pairs template in MetaTrader is relatively simple and requires two free indicators (these have been included with the tutorial). The first indicator is that of the FX Correlator and the second is the overlay chart. Highlighted below are the step by step instructions on adding each to your chart.

1. Open Metatrader and Choose Chart
2. Drag the Overlay Chart onto the open chart window, and specify default settings. Click OK.
3. Attach the FX Correlator to the chart, click INPUTS and change all currencies to FALSE except for USD and AUD. The reason why we are keeping these two as TRUE is outlined in the trade setup section. Click OK.

Trade Setup

You will now see two indicators positioned on the chart window. The top overlay chart will highlight the price of silver in comparison to gold. You will notice that the general trend direction is quite similar (相関関係), however there are points along the timeline where the prices widen and then regress (共和分). These are the points that we are looking to profit from.

The FX correlator is a unique indicator that calculates a spread between the main chart window and specified other crosses. When we added the indicator to the chart, we only specified the AUD and USD currencies. Hence we can only see two coloured linear regression points along the time line. The reason we chose the Aussie dollar, was because of its susceptibility to commodity prices movements and the US dollar is the natural base cross with Gold and Silver.

Trading Opportunities:

• Long Gold and Short Silver when the USD crosses above the AUD on the FX Correlator.
• Short Gold and Long Silver when the USD crosses below the AUD on the FX Correlator.

In the diagram above, we have circled a number of trade setups. On the 14th of May at 4:00, the USD crossed higher than the AUD, triggering a potential Short Silver/Long Gold scenario. According to the chart, Silver regressed back to the mean and overlapped Gold at 12:00. The second possible trade scenario occured on the 15th of May at 20:00. As the AUD crossed above the USD, a Long Silver / Short Gold trade was triggered with the spread widening.

リスク管理

• Tight Stops on both crosses
• Calculate the correlation and cointegration of Gold and Silver regularly (daily basis). If the cointegration breaks down (以下 80%) do not trade.
• Position size should be based on underlying value and may not be equal.

以下の下でファイルさ: 外国為替市場のしくみ?, 戦略の取引のアイデア タグが付いて: 共和分, fx correlator, overlay chart, pairs trading gold silver

線形回帰をチャート

5 月 16, 2013 によって ルパートにより Leave a Comment

線形回帰が全体的な運動量や価格のシリーズの傾向を定義する際に効果的なツールをすることができます。. それはすべてのデータに適応することができます。. 交換の外のフィールド, リスク管理、統計など, 同じ統計的手法を使用します。. 保険会社は、プレミアム レベルを決定、クレームと年齢層の関係がプロットされます一般的.

見通しにそれを入れるため, テレビが 2 台を所有しているグループの 5 人があった場合, テレビがないと 4 つのテレビを所有している二人を所有している人, 大まかな基礎の線形回帰傾向はわずか 2 つのセットの上を示すだろうし、. 標準的なエラーまたは偏差この場合になる 2 つのサンプルはテレビの外、4 つのテレビ.

回帰は、長期的に取引のための効果的なツールをすることができます、これはあまりにも市場のボラティリティと将来価格に影響を受けやすい? どのように線形回帰を本当に理解するための作品します。, 我々 はチャネルとその標準偏差レベルをグラフ化する必要があります。.

エクセルで散布図を見て以下の最初のチュートリアルと線形回帰をプロットする方法. 標準偏差チャネルが含まれていないことに注意してください。.

Excel で回帰をチャート

  1. メタト レーダーのプラットフォームを開き、ツールをクリックしてください, 歴史センター.
  2. 回帰分析に関連するペアを選択します。. タイム フレームを選択したら, エクスポートをクリックしてスプレッドシートを保存.
  3. 拡散シートを開き、散布図を使用したい 2 つの関連列を強調表示. 上の図で時間を使いました。 (分) 価格.
  4. [挿入] をクリックして、散布図. ドロップ ダウン メニューが表示されます。. 真の反射を取得するには, 散布図でのみマーカーをクリックします。.
  5. ドット価格データの分布を表すグラフが表示されます。. 線形回帰を解読するには, グラフを強調表示し、excel メニューからレイアウトをクリックしてください.
  6. トレンド ラインに移動します. ドロップ ダウン メニューは、いくつかのオプションが表示されます。. 線形トレンド ラインを選択します。. 回帰直線が表示されます。.
Excel linear regression on EURUSD M5 data

Excel は、メタト レーダー M5 グラフからのデータを使用して EURSUD 価格の線形回帰を描画します。

前述のとおり, excel のグラフの基本的な傾向を与えるだけと詳細な標準偏差を持つユーザーを提供しません. 短期的には現実的な解釈のためあまりにも多くのデータを強調表示を行うことをもお勧めします.

上の図で EURUSD の 5 分間データの 8 時間を越える指定しました。.

メタト レーダーでチャートの線形回帰

  1. メタト レーダーでグラフと時間枠を開く
  2. クリックして挿入とチャンネル. 一覧でその後にいたします。. 線形回帰を選択します。.
  3. マウスの左ボタンを押したまま、必要な期間にわたって線形回帰をドラッグ. 上の図で, 13 日の 5 月の開始日と線形回帰を選びました 10:30.
  4. 回帰直線が表示され、データによると調整することに気づくでしょう. 1 つの標準偏差も表示されます。.
  5. グラフの 2 番目の偏差チャネルを希望の場合, 端末メニューの先頭に戻る移動し、挿入をクリックしてください – チャンネルは、標準偏差を選択. マウスの左ボタンを使用して標準偏差チャネルをドラッグし、同じ期間を指定する必要.
A linear regression of the EURUSD

メタト レーダーは、価格の動きを解釈し、回帰直線を描画します

勧告

回帰を使用しての取引はお勧め, 揮発性を管理するために短い範囲を指定すること. 価格シフトとして, チャネルが、します。, 利益を取れる可能性がありますすぐに損失に.

価格で暴力的な振動背部場合タイトなストップが常に重要です。.

以下の下でファイルさ: 外国為替市場のしくみ?, 戦略の取引のアイデア タグが付いて: 標準偏差をグラフ化, 共和分, 相関と取引ペア, 線形回帰

相関関係対. 共和分

5 月 6, 2013 によって ショーンオバートン Leave a Comment

相関と共和は、一般的取引コミュニティによって誤用される 2 つの基に回帰分析概念. その定式化の複合体, 両方ともインター関連し、を使用して 2 つ以上の製品との関係を計算 (すなわち商品, 外国為替, 株価) 特定の期間にわたって.

相関関係

値 +1 (正の相関) または -1 (負の相関) 割り当てられているどのように効率的に互いに反応する 2 つの価格. 相関は、タンデムまたは反対の方向で移動するペアを指定します。.

長期相関組み合わせの良い例は、EURUSD は、USDCHF の交差, ような方向で取引します。. コインの他の側に, EURGBP と、AUDNZD の反対の方向の貿易します。. 彼らは負の相関を示す -0.81.

ただし、この図は、十字架が互いに移動したことを示します, この否定的な結果の長期的持続性不確実性のわずかな程度があります。. プロのトレーダーは通常の上または下のペア エントリ ベンチマークを設定します。 0.9 または -0.9.

相関の重要な欠点があります。, 収益性に大きく影響します。. 2 つのペアは相関がありますが, 彼らは完全なユニゾンではまだありません。, 価格のわずかなドリフトを引き起こす可能性. EURGBP と、AUDNZD の場合, それはドリフト -0.19.

上の記事を読む 外国為替の相関関係 トピックの詳細について.

相関関係

画像クレジット: Vassia Atanassova
左側のボックスは、強い相関関係を示しています. 真ん中は、弱い相関を示しています. 右端には相関関係のイメージが表示されます。.

共和分

共和分の価格の動きを分析し、識別する 2 つの値が指定した期間にわたって同じ平均または平均価格に敏感度. それはペアを移動する方向について何も言っていません。. 共和分だけ時間をかけて、それらの間の距離が安定しているかどうかを測定します。.

金と銀なら, たとえば, 我々 は、彼らは一般的な平均値を追跡見つけることが. 反対の方向に取引を一日一日. 将来的にいくつかの不明な時点で, 彼らはその平均値に向かって戻る必要があります、それゆえ彼らは共和分. ヘッジファンドは、一般貿易のペアを識別するプログラム統計的裁定モデルに数式を使用します.

Another important factor to keep in mind is the look back period of the mean and standard deviation. 本質的には, if you make the look back value 700, then the regression channel will calculate what the average price is over 700 期間. This can be too inefficient and will limit the sensitivity to changes in the market dynamic.

反対に, if you set a short look back period, then it will cause a whipsaw effect and will be far too sensitive. It is important to get a balanced look back within the range of 200-350.

Gold and sliver chart show correlation and cointegration

ゴールド / Silver Example

• Top Section: Standard Deviation and Linear Regression
• Middle Section: Relative Performance Gold (dark blue) and Silver (light/ turquoise blue)
• Bottom Section: Gold Daily Chart and Time Line

上記のグラフは金と銀と吹き出物が貿易の機会を引き起こす可能性がある程度の全体的な相関をハイライトします。. 異なる共和分シナリオの数を一周する P1 と 2 番目のセクションでこれらを参照, P2, P3 と P4 のラベル.

シルバーのスパイク – 3 月

3 月中の銀の価格の重要なスパイク送信の低い標準偏差チャネル下の線形回帰値 -2.0. 価格の重大な不一致を活用するには, トレーダーは短絡銀と行く長い金見ているだろう. 性能面では, 銀として全体的な利益の結果だろうこれ大きく弱体化, 5 月の金の下交差点.

銀の売られ過ぎ-7 月

銀の価格が金に相対的なレベルで弱り続けます. 6 月と 7 月に, 回帰値トップの標準偏差チャネル上を通過します。, 銀は売られ過ぎし、価格にお越しの方にもその意味に戻すことを示す. トレーダー銀と短いゴールドのロング ポジションをオープンすることを決定します。. 予想として, その平均に戻るし、すぐに両方のスポット価格の間のギャップを閉じます.

銀のオーバー シュート-12 月

銀の価格が金をオーバー シュート再び. これは長い金を設定します。, 短い銀チャンス. パフォーマンス レベル, トレーダーを活用
普及し、位置からの利益.

シルバー ・ Selloff-4 月

2 番目の標準偏差チャネルを開ける, 銀は大きく弱体化しながら金の価格を安定させる. これが今の長いトレーダーを指定します。
シルバー, 短いゴールド チャンス.

以下の下でファイルさ: 戦略の取引のアイデア タグが付いて: 共和分, 相関関係, ゴールド, シルバー

Forex Correlation

11 月 9, 2011 によって ショーンオバートン Leave a Comment

Correlation strategies appeal to forex traders because it removes the stress associated with picking market direction. When two correlated pairs diverge from one another, the idea is to simply buy one pair and sell the other.

What are correlated currency pairs?

Correlation offers a mathematical probability of two “time series” moving in the same direction. Applying the idea to forex, it means that we need to pick two currency pairs. EURUSD and USDCHF are two popular choices due to their extremely high correlation, so we’ll use those.

Now we ask a simple question: “If the EURUSD rises, what is the probability of that the USDCHF will also rise”? Our calculations will pump out a simple a number between -1 と +1. +1 means that that if Currency A rose in value, then it is 100% certain that Currency B rose in value. -1 means that if Currency A increased in value, then it is 100% certain that Currency B decreased in value. 値 0 means that the movement of Currency A exercises no effect at all on Currency B.

Traders generally consider a correlation significant whenever the number is greater than 70%. EURUSD and USDCHF are so popular because they hold the strongest correlation among the major currency pairs. When market volatility was very low a few years ago, it was around -93%. 今日, the correlation tends to hang around -80%. The European debt problems and Swiss National Bank’s intervention have a lot to do with the decrease in this number. Their trading relationships are far less stable.

Risks of correlation strategies

Let’s move back into familiar territory with my favorite example, the moving average. If you take the average over the past 20 バー, you know from experience that the average will differ if you study a 50 period versus a 200 period average. If you look at the average on a 5 minute chart versus an hourly chart, the number will vary yet again.

The take-away here is that the correlations work the same way. The correlation between EURUSD and USDCHF might even be positive if you look at a short enough time scale. As you back away in time, you will notice that the further out you go, the more steady the correlation numbers look. If the weekly correlation of the EURUSD and USDCHF is -80%, you would expect the numbers to get more wild and erratic as you scale all the way down to a tick chart.

The same problem with the moving average also appears. Studying the correlation over 50 periods provides a responsive number, but it is also far less consistent than the 200 period correlation. What a short period gains in responsiveness, it loses in stability.

You should also consider whether the correlation that you’re studying makes fundamental sense. Just because the temperature change in Mongolia predicted the direction of USDJPY for the past week does not make it a good idea to use in the future. The same goes with pair trading.

EURUSD and USDCHF should be highly correlated for two reasons. They both contain the same currency in the pair (米ドル), which half weights them with the same instrument. さらに, the EUR and CHF both have strong trading relationships with the US. You would expect both the Euro Zone and Switzerland to share a need for buying and selling US dollars. They need them for buying oil, importing and exporting to the US, など. Anyone with a cursory understanding of macroeconomics could explain why this relationship makes sense.

Correlation traders typically settle on pairs that share a common currency. The EURUSD and USDCHF trade both share the US dollar. When you buy EURUSD and buy USDCHF, you are really:
Buying EUR and selling USD
Buying USD and selling CHF

Notice that the USD cancels itself out. What you are really doing is buying EUR and selling CHF. This is commonly known as the EURCHF pair. Assuming that the spread is not outrageous, it makes more sense to simply buy or sell EURCHF directly rather than going through the convoluted process of managing two open trades.

If you decide to pursue the two pair approach, you must consider the need to balance the trade sizes against each other. Using standard lots as the example, 100,000 EUR is 137,500 米ドル. 100,000 USD is 90,900 スイス フラン. If you buy one standard lot of EURUSD, you are buying $137,500 of it. When you buy a standard lot of USDCHF, you are only buying $100,000.

$137,500 obviously does not equal $100,000. Unless you intentionally decided to trade different sizes, you may want to consider equalizing them.

Solve for x:
€100,000 / $137,500 = x * (₣90,900/$100,000)
x = €100,000 / ₣90,00 * $100,000 / $137,500 = 0.803
You would need your EURUSD trade to be 80% of the size of the USDCHF trade.

What correlation is not

Correlation only provides insight into the probability of direction. It says absolutely nothing about the strength of a particular move. A few months ago the USDCHF climbed 1,000 points in value within a single day. The EURUSD only moved a few hundred pips. The USDCHF moved dramatically further than the EURUSD both in terms of pips, but more importantly, as a percentage of price.

Consider if you were short EURUSD that day and short USDCHF. You lost a ton of money. 反対側に, if you were long EURUSD and long USDCHF, then you got lucky and earned the move. Regardless of what happened, correlation told you nothing about the outcome when they move in the same direction. For that reason, I prefer looking at a less intuitive method called cointegration.

共和分

Conintegration turns the problem on its head. Rather than asking whether or not two pairs move in the same direction, it asks how likely are they to remain a certain distance apart. 当然のことながら, that distance tends to vary with time. What you want the cointegration formula to tell you is how likely two pairs are to come back to a standard distance. If you see two pairs spread unusually far apart and the numbers tell you that they usually come back together, then it makes sense to consider a pair trade.

Ernest Chan has a friendly introduction to cointegration that I highly recommend. A much uglier, math intensive introduction to the subject, albeit one that is also far more thorough, is in the book Pairs Trading by Ganapathy Vidyamurthy.

以下の下でファイルさ: 外国為替市場のしくみ?, 未分類 タグが付いて: 共和分, 相関関係, 外国為替

メールで無料の取引戦略

トレンド分析

申し訳ありませんが. No data so far.

アーカイブ

  • ルール
  • 外国為替市場のしくみ?
  • インジケーター
  • メタト レーダーのヒント
  • MQL (オタクのため)
  • NinjaTrader ヒント
  • Pilum
  • QB プロ
  • お金を失うことを停止します。
  • あなたの概念を歴史的にテストします。
  • 戦略の取引のアイデア
  • 未分類
  • What's happening in the current markets?

翻訳


無料の取引戦略

プライバシー ポリシーRisk Disclosure

著作権 © 2022 OneStepRemoved.com, (株). すべての権利予約.