アルゴリズムと機械の外国為替戦略 | OneStepRemoved

  • Articles
  • Sophisticated Web Sites
  • Automated Trading
  • お客様の声
  • お問い合わせ

転送最適化を歩く

1 月 13, 2014 によって ショーンオバートン 6 コメント

歩いていたし、ランダムに雨が降り始めた場合, 明日は傘を持って考慮します。? もちろん、.

人々が行動を観察したとき、私はそのような修辞的な質問をする理由は、, それらはそれに応じて応答します. 彼らは何かが再び起こる可能性があることが予想される場合, 彼らは結果の変化に対応するために彼らの行動を変えます.

あなたは外国為替のロボットを考えるとき, 誰もが永遠に動作する戦略を開発するという夢を持っています. これは、変更する必要はありません. 初期設定は、常に動作. それをオンにし、ビーチに移動.

現実, もちろんです, それよりも複雑です.

walk forward optimization

ウォークフォワード最適化は継続時間の代わりに、静的な設定のいずれかのセットを探して全体最適化

あなたの戦略は、必然的にゆがんで行くときそれはあなたが何をする必要があるかの期待につながります. それはあなたが現在の市場にも驚くほど動作しない戦略を考え出すことは非常に可能性があります. しかし, 過去の天才は、将来の天才を意味するものではありません. あなたの戦略は、もはや将来的に動作しません可能性が常にあります.

何故ですか? それが今日雨が降れば、それはあなたが明日傘を運ぶかもしれないのと同じ理由です. 人々は一貫した方法で行う市場を観察. より多くの人々は、観測を行うと, 人々はそれに取引を開始します. 市場では、これらの変化に対応, あまりにも多くの人々がそれについて耳いるとして、最終的に機会が完全に洗います.

ウォークフォワードテストは、あなたの戦略が洗い流さしたかどうかを決定するプロセスです. データの1セットでテストすることにより, そして、ブラインドセットにそれをテスト, あなた自身にあなたの戦略が悪いかどうかの指標を与えることができます. ウォークフォワードの目標は、あなたの戦略が良好であることを証明することではありません. それはあなたの戦略が悪いことが知られていないことを証明することです.

ウォークフォワードテストのプロセスは非常に簡単です. あなたは、あなたのテストに使用する情報のセットを識別し、 最適化. 実際の例を使用して, 今ではの始まりに 2014. だから、多分あなたはからデータを見て、テストしたいです 2011 を通じて 2012. それはあなたの中のサンプルデータになります, し、サンプルデータのうち、あなたはすべての可能性があります 2013.

歩行フォワードテストを行うために, あなたはあなたの戦略をテストし、分析することになります 2011-2012. その後、, それはだかどうかを判断します “悪いことが知られていません”, あなたは、その後に先に歩きます 2103 見るために性能を確認.

あなたがやったことはブラインドテストであります. あなたはどのように戦略がで実行することになりかわかりませんでした 2013 あなたはそれをテストしたとき 2011-2012. ブラインドサンプルの上に置くことによって、, あなたはそれを失敗する機会を与えます.

それはあなたの最適化の弱点を識別するための絶対的な最高のツールだから非常に多くのトレーダーは徒歩フォワードテストで自分たちの信仰を置く理由は、. あなたは戦略をテストしているとき, それはあなたが過去の機会にオーバーフィットをした可能性が非常に高いです.

自己フィードバックは、現在の市場でループ

私はあなたに例を挙げましょう. 現在の市場では, トレーダーの多くはされています 叩い金 市場にどこの市場で毎日が開いて開きます。, 彼らはおそらくできる限り金を売却. 場合によっては、数分のスパンでの年間生産量の数倍です. あなたは何を参照してください5または10分間の絶対的自由落下であります. その状態は、一度日間持続します. しかし、それは永遠に続きません. 十分なトレーダーは、人々がオープンに金を強打することを見て起動すると、, 彼らは同じことをやって起動します.

効果的, 誰が彼らのためにその取引を行うために他のトレーダーを教えていた金は、市場のオープンにフォールオフしたいです. 人々は金が開いて最初の5分で落ちることを期待したよう, 彼らはその後、彼らの行動を変えます. いくつかは、オープンを叩いにジャンプし、短い移動しよう.

他の人は自分の動作を変更する開始します. 彼らは、5分間その金無料の落下に注意してください. その後、, 突然止まります, そのようなよりは平均値に戻ります. 非常に多くの分が開いてから経過した彼らは、タックと買いを変え始めましょう. 彼らは販売に先行重いボリュームが最終的に正常に戻ることを期待. 人々は彼らの行動を変更すると, 他の人が親切に対応します.

十分な人々がオープンに販売を開始し、その後、オープン5分で購入する場合, あなたは一人が別​​のアクションに応答する場合はパターンが形成されていることがわかります. それは日の最初のカップルのために働いていた状態がもはや将来的に機能する自己フィードバックループです.

あなたはこれらの条件に耐えることがある戦略を識別することができた場合, あなたが任意のテストと最適化をしなかった条件に耐えることがあります, あなた自身の将来に成功したのより良いオッズを与えます. それは非常に多くはないトレーダーは、あなたが発見したこの取引チャンスに物事をよく分かっていることを意味し.

フォワードテストを歩くためのアプローチは、として知られている問題に対する解毒剤であります カーブフィッティング. カーブフィッティングはcould haveの縮約形should haveの縮約形戦略究極のwould haveの縮約形であります. 昨日から、チャートを開いて、私はここで買っただろうと私はここに販売したと言っに似です, すでに蒸散何を知ります.

もちろん、あなたがしようとしています “稼ぐ” 其れでは. あなたは、市場が何をしたか、完璧な情報を知っています. 将来は, あなたは完璧な情報がわかりません. 戦略の目標は、そのあいまいさに対処することです.

新しい状況が必然的に発生していることをあなたが過去の市場の状況にまで完璧にフィットのすべてをしたカーブフィッティング手段, フレーズに似て一種の, “歴史は繰り返さありません, それは韻を踏みます,” あなたの戦略は、同じことを行い.

あなたは過去の実績でもない戦略をしたいです, しかし、あなたは歴史的な市場でお金を稼ぐための戦略を考え出すていません. 戦略を開発する目的は、将来の市場でお金を稼ぐことです. あなたはバックテストしているとき, あなたは、固体の歴史的性能とのバランスをしようとしています, 最も重要なこと, その歴史的知識が将来の業績に外挿することを確認すること. あなたの目標は、お金を稼ぐことです.

ローリングウォークフォワード最適化

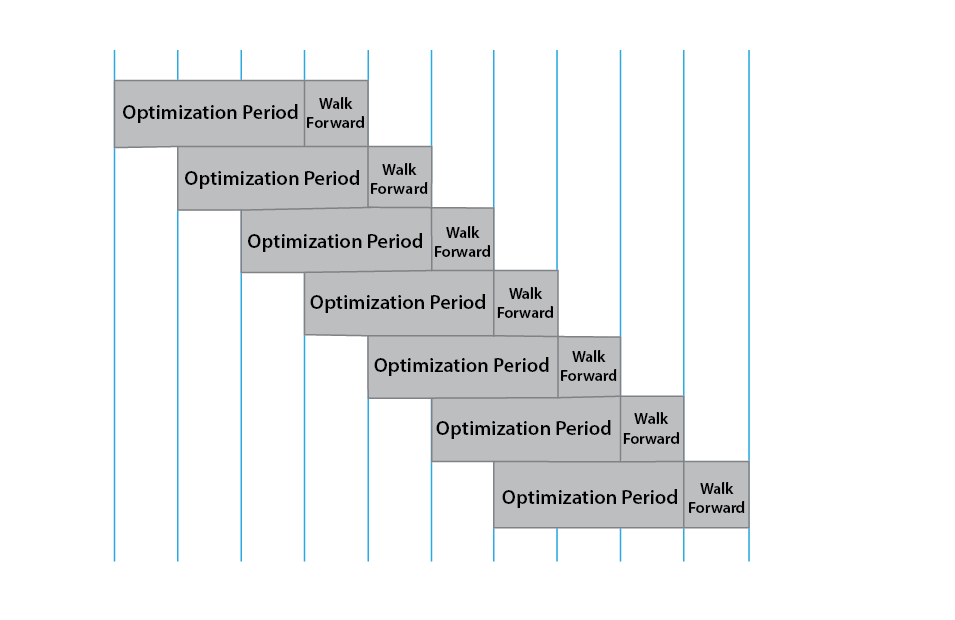
ローリングウォークフォワード最適化は徒歩前方にアイデアを取り、継続的に新しいデータにそれを暴露することによって、戦略を改善. それでは、あなたが24ヶ月のサンプル期間を持っているとしましょう. それについて移動するための一つの方法は、二ヶ月の期間、あなたの戦略を最適化することであろう, その後、3ヶ月目に前方に歩いて. あなたは行動を観察し、あなたは、第2、第3の月の再最適化, その後、4番目の月を楽しみにして歩きます.

連続的にそうすることによって, あなたは戦略の減衰時間を排除し、それを継続的な市場の状況に適応する機会を与えます. これは、機械学習に赤毛の継子の一種であります. 経験と損失は戦略に徒歩フォワード最適化により改善し、市場の変化に適応する機会を与えます.

…あなたは戦略の減衰時間を排除し、それを継続的な市場の状況に適応する機会を与えます

散歩フォワード分析のためのもう一つの重要な考慮事項であります 自由度 系内で. たとえば, 例えば、あなたが、移動averaageクロスを分析しているとしましょう. あなたは、2つの移動平均を使用して、固定stoplossを使用して、利益を取るしています. それはあなたに4度の自由度を与えるだろう. 高速移動平均は、最初の学位であります. ゆっくりと移動平均は、二度あります. 第三はstoplossで、4番目はテイク利益であります.

あなたはシステムで許可するより多くの自由度が大幅に過去のデータにあなたのシステムをフィッティングチャンス0F曲線を増加させ. 絶対的な最高のシステムは、12自由度以下に保ちます. あなたは、大規模な取引の数、あなたが満足すること申し出性能を有する取引の機会を見つけたいです.

あなたの最適化の際に考慮すべきもう一つの要素は、あなたがのために最適化されたものです. ほとんどの人は絶対リターンに焦点を当てます. 戻り値は素晴らしいです, ほとんどのトレーダーは、について多くを気に どうやって 彼らはお金を稼ぐの代わりに、 いくら. 私はあなたに例を挙げましょう. 私が作っシステムを持っていた場合 $25,000 昨年, あなたはそれを望みます? ほとんど誰もがそう言います.

私が作っシステムを使用している場合 $25,000 昨年, しかし、あなたはに負けなければなりませんでした $15,000 あなたはお金を作った前に. ほとんどの人は、そのシステムを望んでいません. これが意味することは、最終的な結果ではなく、日々のパフォーマンスについてより多くを気にしていることです. 最適化、さらには徒歩フォワード最適化の問題点は、必ずしもあなたが現実の世界で気に何に焦点を当てていないということです: あなたがあなたのお金を作っている方法.

ほとんどのチャートパッケージは、ネット結果に焦点を当て、それはあなたのシステム内のいくつかの弱点を引き起こす可能性があります. あなたはレンジ取引している場合, あなたが本当にやったことは桜が少なくとも実質的なニュースの影響を受けている結果を選ぶです. 効果で, あなたはまだ影響を受けていません設定を選択しました 脂肪のしっぽ.

あなたはトレンド取引している場合, あなたは正反対をやりました. あなたが意図的に過去に起こった脂肪tailesを最大化の設定を選びます. トレンド取引戦略で, あなたはおそらく安定したパフォーマンスを見つけることするつもりはありません. 代わりに, 何を見つけることは、最適化を頻繁に長い引き起こすことがあります, 絶え間ないドローダウンの継続的な干ばつ. そして、突然、, ほとんどどこからともなく, それはあなたが経験したドローダウンの数倍を返すメガモンスターの勝者を見つけます. これは、架空のbacktestsの罰金です, しかし、現実の世界で、あなたは近く、日常的に損失を被るている場所, ほとんどのトレーダーは、痛みを取ることができません. 私はほとんどの最適化を見つけるの弱点は、彼らはパフォーマンスの一貫性を見ていないということです. 戦略を最適化するための潜在的な代替が見れることになります 線形回帰 経時株式曲線の. 最高の株式曲線は最強の線形回帰の傾きを有します.

ローリングウォークフォワード最適化を実装する人気チャートパッケージはAmibrokerです, 売買, MultichartsとNinjaTrader.

NinjaTraderでウォークフォワード最適化

コントロールセンターから戦略アナライザを開きます. [ファイル] をクリックします。 / 新機能 / 戦略分析.

NinjaTrader Strategy Analyzer selection

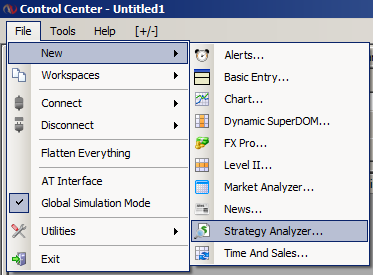
NinjaTrader中戦略・アナライザを開きます。

  1. 楽器や機器のリストの上でマウスの左クリックと右のマウス、マウスの右クリックメニューを表示します. メニュー項目ウォークフォワードを選択. また、上でクリックすることができます “で” 戦略分析ツールバーのアイコン. あなたがホットキーを好む場合, あなたはまた、Ctrlキーを使用することができます + W. 最後に, あなたもプッシュすることができます “W” 戦略分析の左上のアイコン.
  2. 戦略引き出しメニューから戦略を選択します
  3. ウォークフォワードプロパティを設定 (参照してください。 “ウォークフォワードの特性を理解します” プロパティ定義については、以下のセクション) し、[OK]ボタンを押してください.
NinjaTrader Walk Forward Optimization

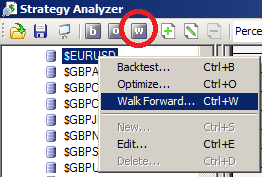
NinjaTraderに散歩前方最適化を選択するための多くの方法があります

ウォークフォワード進行は、コントロール・センターのステータスバーに表示されます.

以下の下でファイルさ: NinjaTrader ヒント, あなたの概念を歴史的にテストします。 タグが付いて: AmiBroker, バックテスト, カーブフィッティング, 脂肪のしっぽ, ゴールド, MultiCharts, ninjatrader, 範囲の取引, 自己フィードバックループ, 短い, 戦略・アナライザ, 売買, トレンド, 前方を歩く

取引のロボットを構築します。

4 月 10, 2013 によって ショーンオバートン 1 コメント

I talk a lot about the importance of building your trading plan. The same thing applies for building a trading robot or an expert advisor.

Most people approach EA development as digging frantically looking for huge gold nuggets. That approach is a good way to waste a lot of time and money.

Most people dive into the process without considering the details. The purpose of this post is to slow everything down so that you can develop some sort of business plan for your trading.

Steps to building a trading robot

Three long, difficult steps are involved with deploying a trading robot. You first need to obtain data for testing. A good strategy, once discovered, then needs to be programmed to automatically place trades. 最後に, you need to select a broker to execute the orders in the live market.

The importance of data

A good number of traders brag about their best trades. One trade gave them a million dollar profit and other such and such.

What newbie system traders don’t realize is the tedious process of how these people reached their status. Knowing whether or not a system has an edge or not entails researching your idea using historical price data. Here are some tips that you can use when looking for data:

• You need to get data, you need to analyze it, and then you need to trade it. It is really simple on the surface, but when you are trying to go about this, every step creates huge obstacles. The easiest work around is to use the trading platforms listed at the bottom of the article.

• If you are looking for free options, you might go look somewhere like Yahoo! Finance where you can get data on lots of stuff that is mostly end of day prices. It’s no good for high frequency. You can get some options data, you can get forex and you can get some indices and some futures data.

• The reason why data quality is important is when we go on to analyze and come up with potential ways that you might want to trade algorithmically, if you have garbage data, you have a garbage analysis. Be very careful about the data that you decide to accept.

Problems gathering data

Now that we learned how important data is, we now discuss the other side of the picture in data gathering which is its disadvantages.

• Unreliable. Sometimes it’s just wrong. Sometimes there are duplicate entries. Sometimes there are gaps in the data that are unexplained. And if you don’t really know what you’re looking for, what kind of problems there might be in the data, you can come up with some weird discoveries.

• Delays. Technology bridges the information gap. しかし、時, due to time differences and the most annoying part when your broker or you are having problems on your internet connection at times, delays are inevitable.

• Clutter. There are a gazillion sources of information on the internet. This equates to a huge amount of data. Different brokers have their own set of websites and blogs which displays various analyses on a single instrument. It will now be a problem on what data will you consider credible and useful in your trade. 時々, analysts just anticipate most especially technical analysts posting price forecasts and so on. Those who waits for news like Unemployment rate has their own views on figures that will show up prior and during the announcement which basically creates clutter.

The Trading Platform

When you trade online, a trading platform is like your playing field. It is the software through which you manage your trades when you open, close or set limits or stops. 通常, a trading platform is provided by the broker.

There are platforms, APIs and all sorts of different companies that offer data and trading capabilities all in the same product. The advantage to those types of software is that it makes your life a lot easier because if you go about this on your own it’s a monumental task.

A lot of people that like to play with R, and you can just custom program your own research platform. Matlab and R are the most common tools in this category. The problem is that you have to build the trading components entirely on your own.

Here are some popular platforms MetaTrader, NinjaTrader, ThinkorSwim and Multicharts. All these platforms use their own different language and solve the data problem. They also include the ability to trade automatically. Most of the heavy lifting has already been done.

MetaTrader uses a custom language called MQL4, which is really a C Scripting Language. NinjaTrader uses C# .NET 3.5. Trade Station and Multicharts is a language called EasyLanguage, which for programmers will probably bore you to tears. To understand more about these platforms, you can check different brokers and their offerings.

Trading Platforms and data

We’ve covered the languages, the markets they cover and then, the other problem is really data. These platforms offer very different set-ups and they all handle the data problem differently.

メタト レーダー

MetaTrader is kind of like the AK-47 of Trade Platforms. You download it and it doesn’t matter how novice or not good with computers you are. You will have a hard time not figuring out how to work the platform. It is simple, it’s very friendly. It’s also not sophisticated.

If you’re trying to do something sophisticated, that’s probably not the place to be. And for your analysis, you have to be very careful, because when you download MetaTrader, charts just pop up. You think, “Oh this is great, I got my data and everything looks good”, but the problem is that most of the time the data is junk. You can’t actually rely on it and do any serious analysis.

Getting the data and getting it formatted to MetaTrader is the most convoluted, difficult problem that traders face everyday. This is the platform that we deal with and everybody has problems with their backtesting and getting familiar.

This is good enough if you want to trade every couple of minutes and you’re not super execution sensitive and you are just trying to get something out cheaply. If you try every 4 hours and you trade 3 通貨, MetaTrader is fantastic for that.

But if you try to day trade or trade 20 different currencies at the same time, that’s a disaster, because MT4 isn’t multi-threaded. Every time you push an order into the market, MT4 can only handle it one at a time.

ある場合 5 orders firing off together, this one has to finish, and you have all the latency in the middle where they connect and then bounce and the trade confirms okay. Now you repeat the process four more times to get all 5 trades filled. If you’re pushing too many orders through, MT4 will choke.

NinjaTrader

You have to find somebody to give you the data. There are some paid options, there are some, there’s one that’s free called Kinetick, and they give you end of day data. Brokerages also provide limited historical data. The quantity varies substantially from broker to broker.

The problem when you’re programming all this stuff and you’re trading in the live market, if you program to a broker specific platform, you probably spend 4 宛先 6 months developing and testing it and getting it working, and a lot of money and time. If you go to start trading live and you’re not happy with the broker, too bad. You married them.

What NinjaTrader did is, let’s say that there are Brokers A, B and C. NinjaTrader sits on top to bridge everything together.

NinjaTrader is an API shoved on top of multiple broker APIs so that you can write your strategy in NinjaTrader. They’ve done all the integration with every broker partner they have.

It’s a different way to handle the same problem as MetaTrader. MetaTrader just goes to these brokers and say “You should use our platform”. If you developed in MetaTrader, you can go switch on a whim.

If you have NinjaTrader, you can go switch on a whim. The difference is that you don’t just have NinjaTrader. You have to download the broker platform, then you download NinjaTrader. その後、, you get everything hooked up and make sure everything plays nicely together.

There’s a steep learning curve with getting this all set-up to the point where you can actually download historical data and start trading with your broker. Once you have the data set-up, しかし, NinjaTrader is awesome.

TradeStation and Multicharts

TradeStation and Multicharts offer the same quality of analytics as NinjaTrader. They are easier to develop in. Obtaining data quickly makes these platforms easier for testing trading robots.

If you program with TradeStation, you trade with Trade Station. You can’t go trade with anybody else. しかし, if you’re ever unsatisfied with the broker because they slip you or because they charge bad commissions or whatever goes wrong with your trading, you don’t have any alternative. You’d have to move to MultiCharts or to redevelop the programming completely from scratch in another platform.

A trading robot

The Broker

Remember that your broker is your trading partner. It provides you the platform, data and most importantly the access in the market. Brokers are also service providers, and traders are their customers. It’s common for a customer to encounter some difficulties regarding the provider. There are two common reasons why a customer sometimes feels dissatisfied.

• First, bad service. When you are having difficulties opening your platform to execute a trade, you call on a customer service representative. And just like any other companies, a structured way of handling complaints will be given to you. Sometimes they can’t just give you what you need because they do not want to understand what you need.

• The second reason is bad execution. The broker is the market maker. They set the buying and selling prices at every single second. When you place a trade, they can present prices that are favorable to them. トレーダーとして, when you know that the trend is on your side, sometimes you do not mind trading few pips higher or lower than your order. So you grab the offer. Until you realize that the broker made some hefty spread on your trades. This affects the trader emotionally and emotions should be out of trading. Emotions spoil strategies nut as a human being, it’s natural to feel upset.

結論

Building your own trading robot is not as easy as ABC. It entails allot of effort in research, trying and testing trading signals and detaching every trade from your emotions. All of these steps are built on the foundation of your trading experience.

Remember that building a trading robot is anchored with the basic steps:
• Gathering and identifying the data you will use. Be very keen on what data to retain and what data will go directly to the bin. Not all data fed by your broker, articles written by analysts or data given to you by someone you know are reliable. Make sure to get the right data, analyze the data and trade using the data.

• A trading platform you are comfortable with. Before you start making your own trading robot, feel free to try different trading platforms. It’s like trying on some new pair of shoes before buying them. Do not go for something very complicated and you cannot even decode some basic functions. Remember that your platform is your playing field. It is more fun to trade through a platform you know how to operate than to get the most technical one and read through the help section while some other traders are gaining fast from a current trend.

• A reliable broker that will assist you on your trades. Your broker is your partner. It gives you data, platform and sometimes analysis in real time. Make sure to choose the broker that can give you what you demand and what you need.

If you will follow some of the above tips, you are on the right track on making your own trading robot.

以下の下でファイルさ: 戦略の取引のアイデア タグが付いて: ビジネス プラン, 専門家アドバイザー, メタト レーダー, MultiCharts, ninjatrader, 売買, trading robot

メールで無料の取引戦略

トレンド分析

申し訳ありませんが. No data so far.

アーカイブ

  • ルール
  • 外国為替市場のしくみ?
  • インジケーター
  • メタト レーダーのヒント
  • MQL (オタクのため)
  • NinjaTrader ヒント
  • Pilum
  • QB プロ
  • お金を失うことを停止します。
  • あなたの概念を歴史的にテストします。
  • 戦略の取引のアイデア
  • 未分類
  • What's happening in the current markets?

翻訳


無料の取引戦略

プライバシー ポリシーRisk Disclosure

著作権 © 2022 OneStepRemoved.com, (株). すべての権利予約.