アルゴリズムと機械の外国為替戦略 | OneStepRemoved

  • Articles
  • Sophisticated Web Sites
  • Automated Trading
  • お客様の声
  • お問い合わせ

Use Fibonacci Expansions to Set a Limit

8 月 30, 2016 によって リオル Alkalay 7 コメント

You’re about to ride a bullish trend; you plan your stop loss and gauge how much you can risk. You also know the rule of thumb—that is that your profit should be at least twice the amount you are willing to risk. But how can you know if the trade you’re considering really has potential that is worth twice the risk? The Fibonacci Expansion is a great tool that allows you to assess the potential of a bullish trend, especially when used with other indicators.

Drawing the Fibonacci Expansion

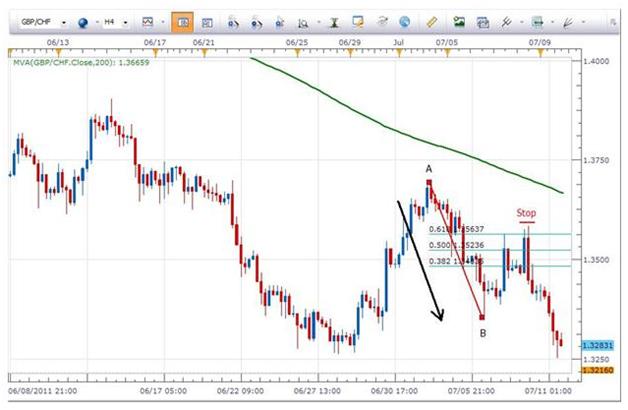
The Fibonacci Expansion on a MetaTrader trend line has three dots yet only the first and third are really worth your focus. The first dot has to be placed at the beginning of the first wave in our expansion wave and the third dot should be placed at the beginning of the second wave.

フィボナッチ

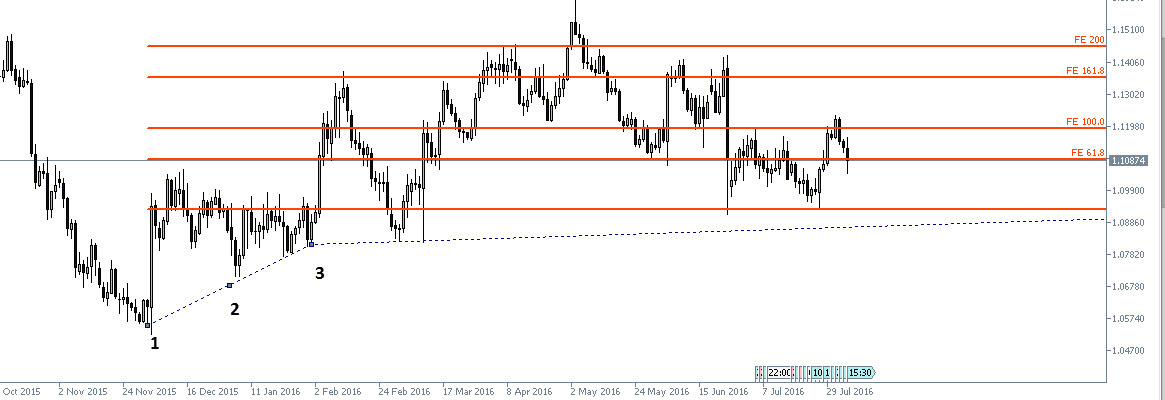
Caution: One of the biggest pitfalls in the Fibonacci Expansion is the failure to recognize the second wave. The second wave can only be considered a second wave if it is higher than the first; if it did not create a new high, it’s either not the second wave or, worse, there’s no expansion.

After the Fibonacci Expansion has been drawn, we can see the various levels of possible resistance. It is important to notice that, 確かに, the various levels of Fibonacci are acting as resistance levels, especially the 61.8% と、 161.8%. If the Fibonacci levels and resistance levels do not align on key levels, the Fibonacci Expansion was drawn incorrectly.

Setting your Limit

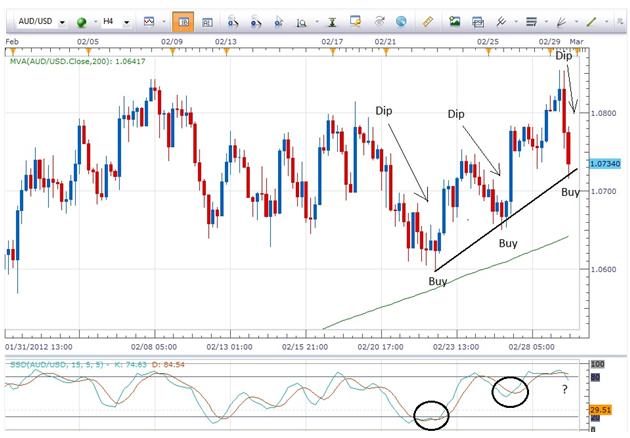
When the Fibonacci levels are overlaid, you can get an indication on possible targets for your trend and can decide accordingly on which level to place your limit. If the limit is more than twice the distance in pips to your stop loss, that is a confirmation that the trade is worthwhile.

フィボナッチ

Now you are left with a key decision: where is the potential limit for this trade? That will depend on your degree of conservatism, すなわち. your risk threshold. たとえば, placing your limit at the 200% level is somewhat aggressive. If you have to place your limit on that level to gain twice what you are risking, you are taking quite a chance because there is no margin of safety. But if you set your limit at 161.8% and that gives you twice what you are risking, then there is more margin for safety, and the pair is more likely to fit the 161.8% level than it is the 200%. If the pair surges beyond the 200% level you can repeat the drawing process and stretch a new line and get a new potential target.

Rules to Remember

The biggest risk with Fibonacci, whether it’s expansion or retracement, is that if you stretch it wrong, your entire strategy can go wrong, including your potential target. One way to avoid such a pitfall is to use the second wave rule of thumb. Another way to minimize risk is to calibrate Fibonacci using パラボリック SAR. It is also important to remember that, just like any other trend or support line, the higher you go on the intervals – daily, weekly, monthly – the more accurate it is likely to be (その逆, もちろんです). 最後に, and perhaps the most important thing, is the understanding that Fibonacci does not determine trend—YOU must determine whether or not the trend is, 確かに, bullish before considering the Fibonacci expansion as accurate.

以下の下でファイルさ: 戦略の取引のアイデア タグが付いて: フィボナッチ, パラボリック SAR, 利益のターゲット, retracement

How to Trade the GBP after Brexit

7 月 12, 2016 によって リオル Alkalay 2 コメント

The selloff in GBP pairs after Brexit presents a challenge for a trader. At first glance, the strategy for the key GBP pairs, mainly that of the GBP/USD and GBP/JPY, should be simple. The GBP is in vertical short, falling almost in a horizontal line; therefore, the trader should apply a vertical short strategy. But when it comes to the GBP, and for that matter, any pair trading at multi-decade lows, the game plan should be slightly different. So without further ado, here are some tips to trade the GBP after Brexit and any pair that is under its historical lows.

英国ポンド: Two Risks

In the aftermath of the GBP Brexit meltdown, GBP pairs, such as the GBP/USD, have two major risks that we have to navigate around – direction and momentum.

Direction – Since we are talking about multi-year lows, we cannot know when the bottom will emerge, because the pair is in uncharted territory.

Momentum – Again, we have no way of knowing when the momentum will change from vertical bearish movement to a trend to a possible range bound.

So how do we handle those unknowns? We use strategies that minimize the risk from the elements.

Buy on Hammer Reversal

As we can see in the chart below, and as is common when a vertical short occurs, after the vertical short comes a brief bounce. What indicates that that bounce is coming is a hammer reversal candle. A hammer reversal candle is a candle where the middle is long and the opening price and closing price are very close. Once we get a hammer reversal candle we can expect a small bounce.

To increase our confidence in an upcoming bounce we can and should combine a MACD indicator. If the MACD indicator suggests weakening momentum, we get a confirmation. Once we get our confirmation it is a signal to buy; our limit should be set below the opening price of the first full bearish candle of the latest vertical short.

英国ポンド

Why should we use this strategy? When we have no indication as to when the pair will bottom out, it’s hard to take a short without risking a sudden bounce back. Normally, it’s less advisable to trade but, under the current conditions, this pattern gives us a chance to reduce the risk of the unknown and minimize the time we are exposed to a choppy market.

Sell on a Major Pull Back

At some stage, every short, no matter how strong, gets a major pull back. That will be our first real opportunity for a short entry. Once we get a major reversal, and by major I mean at least 38.2% of a Fibonacci retracement, then we will get our opportunity to short. That’s because no bearish trend ends without at least two attempts at the same low. That means that, at such a stage, we are no longer in an unknown and our target is the pair’s lowest point.

It’s important to note that when a pair experiences a major retracement it usually signals the end of a vertical short movement and thus is a signal for us to stop using our hammer reversal strategy.

Our limit is now known, aka the low of the pair. And our signal to short can be varied, as in trading a short under any other circumstance. Oscillators such as the MACD, 平均真の範囲 and the Stochastic Oscillator can help us time the resumption of the bearish momentum and ride the bearish wave.

But what’s important to understand here is that after a major retracement, it’s much safer to start trading on a longer term and ride a bearish wave.

結論として

Although those insights have been implemented on the latest meltdown in GBP pairs, the tactics we learned here are not only useful for the GBP but can prepare you for the next FX pair meltdown, whether it’s the Euro pairs or the Brazilian Real pairs. What those tactics teach you is how to trade a rather risky situation with plenty of uncertainty. 確認して, it is still risky to trade a currency in a meltdown, but at least, with the tactics above, you can avoid the major pitfalls.

以下の下でファイルさ: 現在の市場で起きていること? タグが付いて: Brexit, candlestick charting, フィボナッチ, GBPUSD, hammer, oscillator, retracement

基本のフィボナッチ戦略

3 月 30, 2015 によって リチャード ・ Krivo 3 コメント

あなたはおそらく古い取引格言を聞いたこと: トレンドの方向で取引, it is beneficial to the trader to buy on dips in an uptrend and sell on rallies in a downtrend. I would totally agree with that.

The part that can be challenging when implementing the above, is knowing how far a pair is likely to retrace before it begins moving back in the direction of the dominant trend.

最初です, no one knows with any certainty how far a pair might retrace. しかし, as traders we can make some educated assumptions.

When it comes to making informed assumptions about retracements in trading, we can thank Leonardo Fibonacci – arguably the most talented mathematician of the Middle Ages.


Leo Fibo


1170 – 1250


To learn how we can put his knowledge to work in our trading , let’s take a look at the historical 4 hour chart of the GBPCHF currency pair below for an example…

Fib Leo

Since the Daily chart on this pair is in a downtrend, we know that we only want to look for opportunities to sell this pair as that would be the higher probability trade. For our example, let’s look at the bearish move that the pair recently made between point A and point B on the chart. Having seen that downside move and then seeing price action begin to retrace to the upside, the prudent trader will be wondering at what point the upside move will subside and stall. They will want to know that because once the pair stalls it is at that point that they can short the pair back in the direction of the Daily trend.

While no indicator or trading tool can offer absolute, unassailable data on when the retracement will end, the Fibonacci tool can shed some light on the situation and provide three levels that the trader can monitor.

By drawing our Fib line in the direction of the move between point A (Swing High) and point B (Swing Low), we can see that the three primary Fib retracement levels are placed on our chart: 38.2%, 50.0% と 61.8%. It is these levels that we will monitor.

(In an uptrend we would draw the Fib line from the Swing Low to the Swing High.)

理想的には, we are looking for a pullback (retracement) to at least the 50% Fib level or, better yet, 、 61.8% レベル. The further price retraces before it stalls, the greater the likelihood that the pair will drop further and continue its move in the direction of the Daily trend. We can see on this chart that price action cooperated nicely and retraced to above the 61.8% level before making a strong move to the downside.

When using the Fib tool, we are looking for price action to stall at one of the Fib levels – the higher the better.

Since in our example we have a couple of long wicks at the 61.8% レベル, a trader can decide to short the pair at the close of the candle with a stop just above the highest wick.

While this is by no means a fool-proof method for entering a trade, it does provide some helpful information for a trader who is attempting to gain insight on the question of a likely retracement level.


すべて最高と良い取引,

リチャード ・ Krivo

RKrivoFX@gmail.com

@RKrivoFX

以下の下でファイルさ: 戦略の取引のアイデア タグが付いて: フィボナッチ, retracement, トレンド

ディップを購入し、集会を販売: 私達の好意に確率を入れてください。

3 月 19, 2015 によって リチャード ・ Krivo Leave a Comment

強い反対傾向移動後, 限り、長期的な傾向はそのまま, 機会を捜しています。 “buy the dip” と “sell the rally” can be a solid trading strategy.

When identifying a pair that is in an uptrend, the concept of buying the dip can be put to good use. The idea is that as the pair continues to move higher, invariably there will be pullbacks/retracements/dips that occur. When those take place, the trader is presented with an opportunity to enter the trade – buy on a dip – in the direction of the trend at a more favorable price.

Take a look at the historical 4 hour chart of the AUDUSD below for a visual on this concept…

Buying the Dip in an Uptrend

buying dips


To time our entry into the trade, an oscillator can be used so we can enter when bearish (downside) momentum shifts to bullish (upside) momentum. In this case we chose Slow Stochastics. (Note the timing of the entry with the Slow Stochastics crossover to the upside in the circles.) When the buying on dips a stop can be placed below the lowest candle or wick that occurred during the retracement or dip. この場合, we also have a valid ascending trendline (black line) that can be used for stop placement below the trendline.

dice

In a downtrend, the process would be reversed. Take a look at the historical 1 hour chart of the USDCAD below…

Selling the Rally in a Downtrend

selling rallies


To time our entry into this trade, we can enter when bullish (upside) momentum shifts to bearish (downside) momentum. Again we chose Slow Stochastics. (Note the timing of the entry with the Slow Stochastics crossover to the downside in the circles.) When selling on rallies a stop can be placed above the highest candle or wick that occurred during the retracement or rally. In this case we again have a valid descending trendline that can be used for stop placement above the trendline.


すべて最高と良い取引,

リチャード ・ Krivo


RKrivoFX@gmail.com

@RKrivoFX

以下の下でファイルさ: 戦略の取引のアイデア タグが付いて: AUDUSD, dips, downtrend, pullback, rallies, retracement, ストキャスティックス, 近似曲線, uptrend, USDCAD

メールで無料の取引戦略

トレンド分析

申し訳ありませんが. No data so far.

アーカイブ

  • ルール
  • 外国為替市場のしくみ?
  • インジケーター
  • メタト レーダーのヒント
  • MQL (オタクのため)
  • NinjaTrader ヒント
  • Pilum
  • QB プロ
  • お金を失うことを停止します。
  • あなたの概念を歴史的にテストします。
  • 戦略の取引のアイデア
  • 未分類
  • What's happening in the current markets?

翻訳


無料の取引戦略

プライバシー ポリシーRisk Disclosure

著作権 © 2023 OneStepRemoved.com, (株). すべての権利予約.