Candlestick charts, using the individual candles as well as the patterns that they form, can provide an abundance of information to the trader. An oftentimes overlooked aspect of these charts is the trading information provided by longer wicked candles – especially when it comes to stop placement.
Many newer traders will decide where to place their stop based on some random number. That number may be derived from how many pips they are comfortable losing or simply some nice round number like 10 or 50 or 100 or whatever.
The point is that their number is arbitrary and, most likely, bears no relationship whatsoever to the price action that they see on a chart.
A more effective way to place a stop is to look for levels of support in a buy or levels of resistance in a sell.
When buying the stop would go below a level of support and when selling the stop would go above the level of resistance.
(Needless to say, when placing any stop by any method, it is imperative that the 5% rule of Money Management be followed.)
To fine tune this even more, a better guide for stop placement is to bring long wicks, if they are present on the chart, into the analysis.
The historical 1 hour chart of the GBPJPY below provides an excellent example of long wicks…
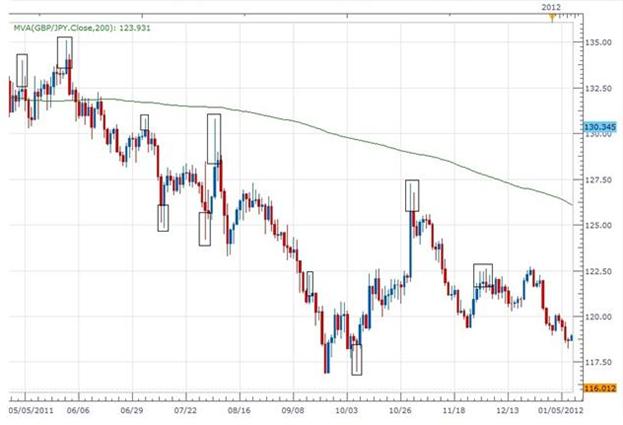
The black rectangles on the chart identify where longer wicks are making an appearance. You can see that the wicks are extended relative to the length of the other wicks around them on the chart.
Notice that after a long wick(s) makes an appearance, oftentimes price will move in the opposite direction of the long wick for a period of time.
In other words, if the longer wick is below the body of the candle, price has a tendency to move up. Conversely, if the longer wick is above the body of the candle, price has a tendency to move down.
So why is that you may ask…
An extended wick at the bottom of a candle shows that sellers were able to push the price down significantly. That is one aspect of what has created the long wick.
However, the selling volume was not great enough to keep the price at that low level. The buyers were able to push price back up from the low – the bottom of the wick – thereby showing strength. That is the second aspect of what creates the long wick.
Since buyers triumphed in that sense, the likelihood exists that the strength of the buyers will endure and, if that is the case, the price will rise.
(In the case of the long wick being above the body of the candle, the opposite scenario might play out and the price would fall.)
So how can a trader effectively make use of this in their trading?
As I always point out, a trader must first take note of the direction of the trend on the Daily chart. If the trend is down, as it is on the pair above, seeing a candle (or several candles for that matter would be even better), with long wicks on their tops, would point toward a strong potential for price to move down…in the direction that the market has already been taking the pair.
So, to continue using an example of a downtrend, if the pair retraces…that is, move against the trend…and stalls at a level of resistance or a Fib level, I am going to be looking for long wicks at the tops of the candles.
There are two reasons for this:
1) Those long wicks indicate the potential for the pair to trade to the downside back in the direction of the Daily trend as the retracement has stalled.
2) The top of the extended wicks provide an excellent guide for a trader to place their stop. The rationale here is that the buyers pushed price to the top of that wick but could not push it beyond that point. As such, placing the stop just above that wick represents a level that has a much lower likelihood of getting hit.
Bottom Line: Observing long wicks forming at levels of support or resistance, especially when they signal potential movement in the direction of the daily trend, can create a beneficial “edge” for the trader especially in regard to stop placement.
Remember – anytime you try out anything new, be sure to try it out numerous times in a demo account until you achieve a level of comfort and understanding.
All the best and good trading,
Richard
@RKrivoFX
rkrivofx@gmail.com
That’s the daily GBPJPY not the hourly.
It seems whether a candle has long wick or not is a function of the chart time frame you’re looking at.
It could be that the component candles from time frames under an hour, or containing candles from timeframes over an hour could have had small wicks.
Do you know which time frames are the most widely used by traders? It seems those would be the timeframes to check wicks on. Maybe it is the one hour time frame.
This is wrong in so many levels. Although what you are saying here makes absolute sense however I can provide many examples where this strategy or whatever it’s called, would’ve had disastrous results, had it been used in a trade. With all due respect, I’ve been following your posts for awhile now and I haven’t seen many with any merits. You simply post lessons randomly without actually having any proper explanations for them. I for one once asked you a question after another so called strategy posted by you and rather than answering me,in an email you asked me to post it as a question in the comment section, having done that, then you simply answered my question via email by simply giving me a bogus answer as if you had no answer to my question at all. It seems pretty clear here that you are simply gathering people’s infos here and selling them to 3rd parties so then they can bombard them with emails and catchy phrases trying to sell lessons or strategies.
Hi Shawn…thanks for your feedback. I understand that I will not be able to please all the people all the time and that is fine. Also, no single strategy or trading tactic is going to work all the time. It’s all about probabilities.
But I definitely enjoy hearing from everyone.
I don’t recall the situation you mentioned regarding your question but if you’d care to resubmit it at RKrivoFX@gmail.com I will respond.
What I can tell you with certainty is that I do not sell any info to 3rd parties.
Thanks again for your thoughts,
Richard
At significant levels it starts to make some sense but using candlesticks alone is a risky strategy. More reliable on longer time frames as more data is collected but either way they should be viewed in context with other factors.
Hi Mike…
I agree. Using candlesticks totally on their own would be quite risky. I tend to use them along with other strategies and, as you say, within the context of other factors and market conditions. My trading tends to make use of longer time frames (Daily,4 hour and 1 hour) for the reasons you suggest – more data leads to more accurate interpretation.
Regards,
Richard