To the average trader, the idea of comparing yourself to a hedge fund may sound a bit absurd. What does a hedge fund, which manages billions upon billions, have in common with your account? Let’s face facts; there are very few of us who have that kind of cash in our trading accounts. Years ago, there was an adage my father taught me, which I believe to this day. That is; “if you can’t measure it, it’s not working.” In business, put another way, if you can’t measure it then it’s probably not worth doing. And really, trading is just like any other business. So if you can’t measure how well your trading strategy is doing, then it’s not working.
Asking the Tough Questions
I’ve been on the receiving end of tons of “advice” on trading and investment – some good, some not so good. My father’s sage advice not only “fits the case” but comes from real world experience. A “measure” forces you to move into the adult world, where you need to ask (and accept the answer to) the tough questions. Do I have a good, sound trading strategy? Am I sticking to the goals I’ve set? Am I taking on too much risk? These are tough questions, and only effective measurements can provide you with the answers.
Why Hedge Funds?
So, why would you measure your trading performance like a hedge fund and not, for instance, an investment portfolio? First, the hedge fund space is the only segment in investment that is the closest to trading. And that is regardless of the hedge fund’s “style.” Furthermore, hedge funds are not limited to a specific strategy. They are usually able to perform and switch positions quickly, just as traders do. In fact, many hedge funds are closer, strategy-wise, to a trader than they are to anything else. As a result, many of the methodologies developed to measure hedge funds are very applicable to trading.
Distribution of Return
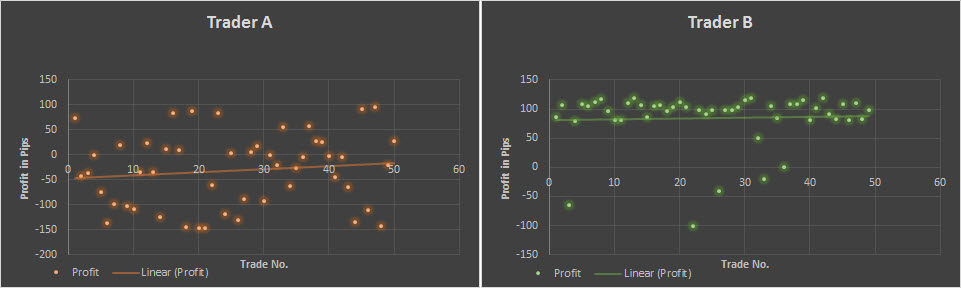
The first measure of your strategy should come from distribution of returns. That may sound complicated but it’s really not. Let’s say your strategy is to gain, on average, 100 pips per trade (and no, we’re not holding you to that). If you export your data to a spreadsheet program and measure each, the distribution of your trading profits should stack up fairly close to 100 pips. In order to illustrate we have two examples of profit distribution. In the one on the left you can see Trader A that failed to deliver the target (a gain 100 pips per trade) with widely scattered results. On the right, we can see the trader B has been able to generally earn in most trades very close to 100 pips. That’s an indication that the strategy that was set has indeed worked pretty much as planned.
Sharpe Ratio
The second tool, the Sharpe ratio, is among the most popular ratios around and essentially measures the return per unit of risk. The calculation may sound complicated, but really it’s rather straightforward. It is the average return after deducting the risk free rate divided by the standard deviation of the returns. Now, what does risk free rate mean? When it comes to investments it means the benchmark rate. When it comes to trading, it means the rate you pay on your margin (i.e. your broker’s fee, which could be as high as 7% p.a.).
But here’s the thing; if you trade primarily in the short term, the Sharpe ratio is less relevant. Moreover, since we are talking about many trades per week or month, it would complicate your analysis and would not necessarily yield better results. If you want to compare your trading performance and you trade in the short term, you don’t need to benchmark yourself to interest rates.
So what is a good Sharpe ratio? Well, the text books say a Sharpe ratio above 1 is generally okay while below 1 is considered not that great. From my own experience, however, a Sharpe ratio at 0.8 or above is absolutely fine. For example, if we take the data from the two sample traders above, Trader A would have a -0.4 Sharpe ratio while Trader B would have 1.8.
The Bottom Line
So what’s the bottom line? What can we learn from the two measurements? Two big things. The first; if your strategy is performing, say you planned to gain 100 pips on average and that’s what your distribution shows, then you’re on track. And the Sharpe ratio? If your Sharpe is low your returns are more a reflection of market volatility than your trading strategy. Conversely, the opposite is also true. Of course, there are many more indicators that hedge funds use, but these two will give you the answers to the tough questions every trader needs to ask.
My history has been in engineering and I know the importance of measuring output and results. You can go know where if you do not measure.
On a side note, what is the Institutional Liquidity banner about? Brokerage, feeds?
Hey Conway,
Thanks for your thoughts. The ILQ banner is a forex brokerage out of Australia. They’re one of my recommended companies.