You’re about to ride a bullish trend; you plan your stop loss and gauge how much you can risk. You also know the rule of thumb—that is that your profit should be at least twice the amount you are willing to risk. But how can you know if the trade you’re considering really has potential that is worth twice the risk? The Fibonacci Expansion is a great tool that allows you to assess the potential of a bullish trend, especially when used with other indicators.
Drawing the Fibonacci Expansion
The Fibonacci Expansion on a MetaTrader trend line has three dots yet only the first and third are really worth your focus. The first dot has to be placed at the beginning of the first wave in our expansion wave and the third dot should be placed at the beginning of the second wave.
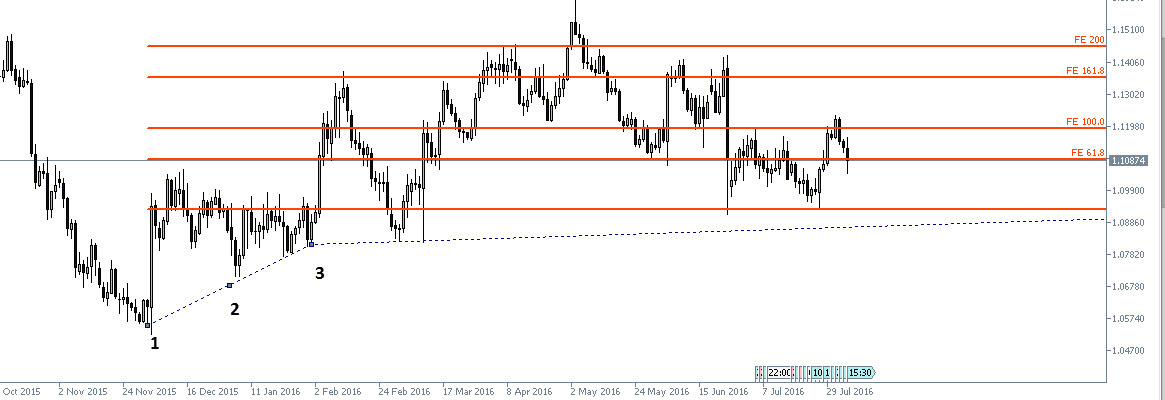
Atenção: One of the biggest pitfalls in the Fibonacci Expansion is the failure to recognize the second wave. The second wave can only be considered a second wave if it is higher than the first; if it did not create a new high, it’s either not the second wave or, worse, there’s no expansion.
After the Fibonacci Expansion has been drawn, we can see the various levels of possible resistance. It is important to notice that, na verdade, the various levels of Fibonacci are acting as resistance levels, especialmente o 61.8% eo 161.8%. If the Fibonacci levels and resistance levels do not align on key levels, the Fibonacci Expansion was drawn incorrectly.
Setting your Limit
When the Fibonacci levels are overlaid, you can get an indication on possible targets for your trend and can decide accordingly on which level to place your limit. If the limit is more than twice the distance in pips to your stop loss, that is a confirmation that the trade is worthwhile.

Now you are left with a key decision: where is the potential limit for this trade? That will depend on your degree of conservatism, I.E. your risk threshold. Por exemplo, placing your limit at the 200% level is somewhat aggressive. If you have to place your limit on that level to gain twice what you are risking, you are taking quite a chance because there is no margin of safety. But if you set your limit at 161.8% and that gives you twice what you are risking, then there is more margin for safety, and the pair is more likely to fit the 161.8% level than it is the 200%. If the pair surges beyond the 200% level you can repeat the drawing process and stretch a new line and get a new potential target.
Rules to Remember
The biggest risk with Fibonacci, whether it’s expansion or retracement, is that if you stretch it wrong, your entire strategy can go wrong, including your potential target. One way to avoid such a pitfall is to use the second wave rule of thumb. Another way to minimize risk is to calibrate Fibonacci using Parabólico SAR. It is also important to remember that, just like any other trend or support line, the higher you go on the intervals – daily, semanal, monthly – the more accurate it is likely to be (e vice-versa, claro). Por fim, and perhaps the most important thing, is the understanding that Fibonacci does not determine trend—YOU must determine whether or not the trend is, na verdade, bullish before considering the Fibonacci expansion as accurate.
Man, your website design sucks!
– Font color and background color are not distinct enough with each other.
– Pictures are too damn small.
– Lines are too tight.
It irritates me just by looking at it. It doesn’t matter how ‘cool’ your website look like now if viewers don’t even want to read its contents!
Don’t take it from me. Look at this SEO monitoring site that shows the traffic drops of your site in past months, thanks to your STUPID design.
https://www.similarweb.com/website/onestepremoved.com
Em essência, your website is BLEEDING. My small advise to you on this is: CHANGE or DIE..!
Obrigado por seus comentários, Eu suponho?
But did you like the system he was explaining?
I can read it fine. BTW
The Fibonacci Expansion on a MetaTrader trend line has three dots yet only the first and third………………….I have the Fib tool but not with MT, can you explain where the lines would be placed as to relation to your MT tool… looks like yours is placing the zero level at the high of the first wave.
Bem,, this Jedi guy surely is a jerk.. But he also showed data to prove his point, Shaun.. But I think not enough to single out a causal relationship between ‘poor’ layout designs and the traffic decline..
I also notice that much lesser articles have been published this year compared to last year. That could also contributes.to lesser traffics. De fato,, more advertising coming from your email blasts instead, There are probably other things you need to look into as well.
De qualquer jeito, the traffic decline is a fact that you ought to address. Jedi has given you a wake up call. I suppose it’s your job to validate/invalidate his accusations and some hypotheses I mentioned above, with the objective to recover the traffic.
Cheers..
The traffic decline happened when Autochartist and I decided to part ways. Também, I agree with you on Jedi.
Artigo interessante, What symbol / instrument is this?