The Stochastic Oscillator can be extremely helpful indicator for determining a market’s momentum. One strategy to benefit from the power of this indicator is to pair it with a 200 unit simple moving average (SMA). This ensures that you are only taking the signals that go in the same direction as the overall trend of a given market.
This system combines the Stochastic Oscillator and 200 unit SMA and produces signals when both are in agreement. The system goes long after a bullish stochastic cross as long as the market is trading above its 200 SMA. It goes short after a bearish cross as long as the market is trading below its 200 SMA. The system exits a position after the Stochastic Oscillator crosses in the opposite direction of the position.
Trading Rules
Chart and Instrument: Any
Period: Any
Market Condition: Trend
Go long When:
Price Closes > 200 SMA
Slow Stoch crosses up
Go short When:
Price Closes < 200 SMA
Slow Stoch crosses down
Exit long when:
Slow Stoch crosses down
Exit short when:
Slow Stoch crosses up
Strategy Analysis
The strength of this system is that it always trades in the same direction as the long term trend. This means that it is never fighting against the current. The system also does very well at timing entry points and should have a strong percentage of successful positions.
The weakness of this system is that it will likely exit a position too early. Rather than continue to ride a given trend, this system is more likely to jump in and out of the trend a number of times. While most of these trades are still winners, this overactive trading will cause slippage and fees to eat away at profits.
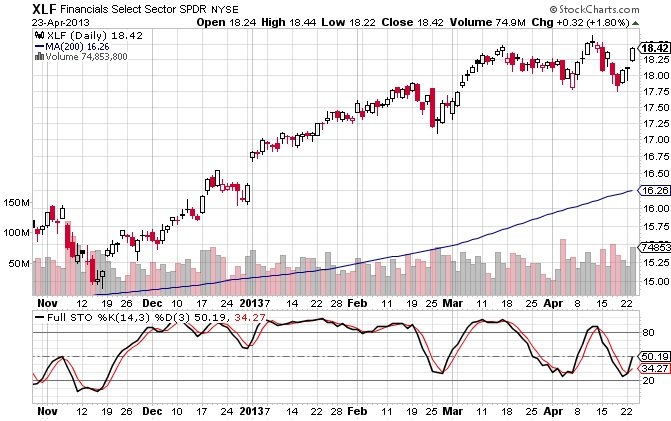
The ETF for the financial sector, XLF, shows a stochastics buy signal
As you can see on this chart of the XLF, the Stochastic Oscillator gave a buy signal at the end of November when the %K line crossed above the %D line while the stock was trading above the 200 day SMA. This was an excellent place to buy the XLF, however the Stochastic Oscillator gave a sell signal a few weeks later, which was followed by many more sudden signals. While most of these signals were correct in the short term, depending on your approach, you might have been better off to hold through all of them.
Ideas For Improvement
Since the weakness with this system is in the exits, perhaps using a different indicator for exits could improve on its performance. I recently discussed using average true range (ATR) to set initial stops. This would be a good way to let the trade run its course, rather than jumping in and out repeatedly.
Another idea to improve this system would be to use a longer term version of the Stochastic Oscillator. By using the Full Stochastic, you can adjust the time period and smooth out both of the lines. This would reduce the number of signals, however it would also reduce the number of entry signals.
It could also be beneficial to limit the Stochastic signals to only count the buy signals when they are in oversold range and only count the sell signals when they are in overbought range. This would drastically reduce the number of signals produced. Extensive backtesting would need to be done to determine its viability.
About The Stochastic Oscillator
The stochastic oscillator is a momentum indicator developed in the late 1950s by George Lane. The indicator is a representation of the closing price of a market compared to that markets price range over a set period of time. The concept is that markets close near highs during uptrends and near lows during downtrends.
The indicator plots two lines, which both represent percentiles of the range over a recent time period. The %K line is the percentile of that day’s close relative to the range of the time period. The %D line is a 3 period exponential moving average of %K.
Since both %K and %D represent percentages, both have a minimum value of 0 and a maximum value of 100. A value of 50 is the midpoint, while a value over 80 is considered overbought, and a value under 20 is considered undersold. It is important to remember that overbought and oversold conditions do not necessarily signal a change in trend. During strong uptrends, markets can remain overbought for an extended period of time. The inverse holds true for strong downtrends.
The Stochastic Oscillator gives a signal when the %K line crosses over the %D line.
How can we improve this strategy? Let me know your ideas in the comments section below.
Try 5 period RSI crossing 13 Period with PSAR (.05,.5,.05) confirmation. That seems to work ok.
Hi Russell,
Thank you for the suggestion.
That sounds interesting! Thanks for the suggestion!
switching to a higher timeframe could be interesting. A Stoch Cross there would cause the exit then.
agreed!
Entry point seems fine – could it be that a simple trailing stop could do the trick?
My thoughts exactly, Rod.
I personally like ATR-based stops, but really the best idea would be to test an assortment of stops and see which produces the best results.