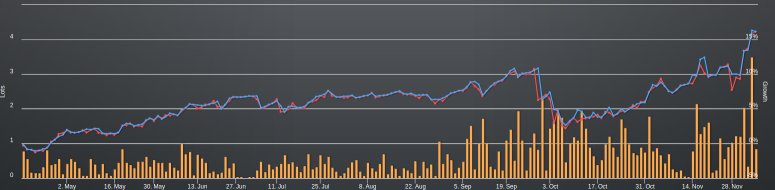
Reaching an all-time high in my equity curve means it’s time to buckle down and keep improving. My Dominari strategy has done very well over the past 7 months and especially this and last month.
Is the party going to continue?
I certainly expect so. Drawdowns are inevitable, but that’s part of trading. Short-term performance is exciting, but my ambitious goal is to turn my starting balance of €8,000 into €50,000 within the next 3 years. As of this writing, I’m at €9,323.
You’re probably wondering how a 16% profit leads me to extrapolate an annual return of nearly 100%. The answer is that I dramatically changed my leverage at the end of September… just in time for that ugly drawdown. If I was trading on my current leverage, the current live return would be around 40% (i.e., right on track to hit my goal).
What really counts is what I’ve really done. So far, I’m up €1,323 with another €40,677 to go by December 6, 2019.
The research for Dominari is effectively finished. It’s been slightly more than a year since I began researching the strategy. Although minor variations of Dominari popped up or came from traders copying my signals, none of them improved the long term outcomes.
One version that improved the risk profile was to trade with limit orders. The original blog post mentioned limit orders, but the variation placed them considerably further from the current market than what I tried previously. I also lacked a system for choosing settings appropriate to every pair, which I’ve more than likely resolved. The problem is that I have a million things on my to-do list and only 8 hours a day. You’ll see some of my top projects when you scroll down.
Pilum: The latest and greatest
Pilum is a strategy based on a statistical process that identifies momentum. One of the scary elements about most quantitative strategies is that most of them are mean-reverting. They buy when the price drops and sell when the price rises. The approach is favorable (i.e., profitable) in the long run, but it takes some psychological fortitude to trade.
Pilum is a major advancement because now I’ll have a strategy that should profit exactly when Dominari is most vulnerable to a drawdown.
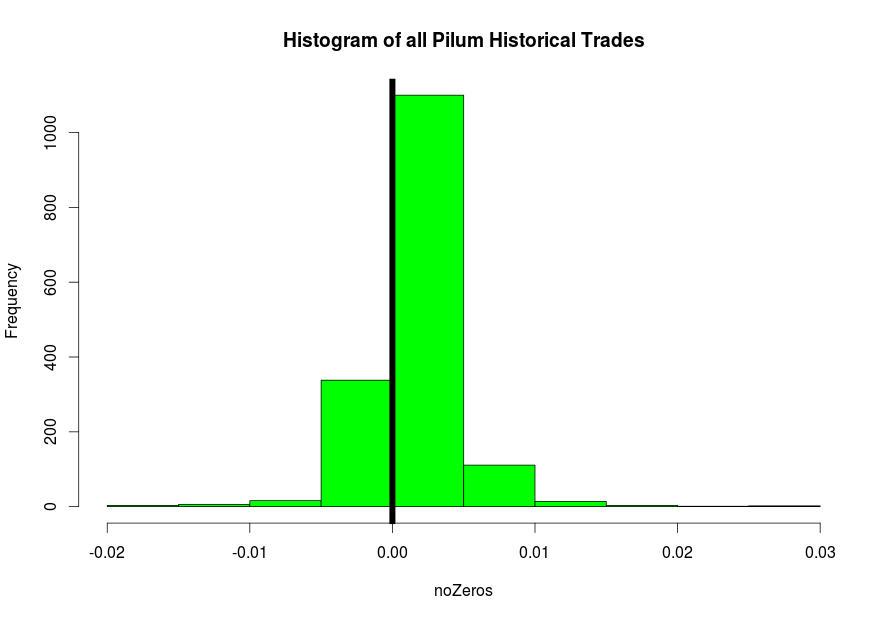
 The new strategy uses limit orders to enter the market. Something like 90% of these orders never execute. But when they do execute, I win 75% of the time. Additionally, my profile of winners to losers is very comfortable.
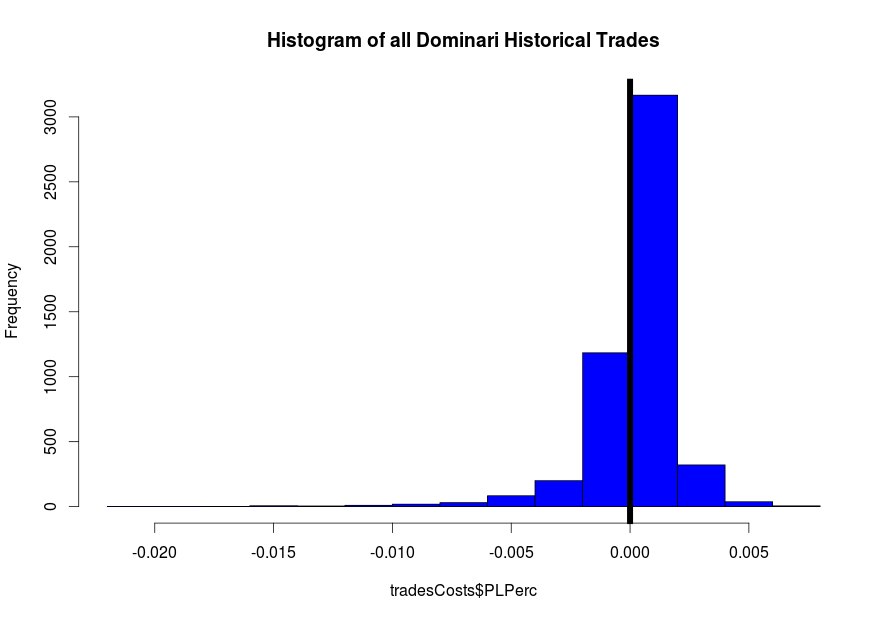
Most traders understand the ideas even if the statistical jargon is unfamiliar. Pilum’s biggest winner is larger than its biggest loss. The average winner is bigger than the average loser. And, it wins 77% of the time.
So far, I’ve done a sort of piecemeal backtest using R. When I finish the Quantilator (see below), I’ll redo the backtest in a fully fledged trading platform. More than likely, I’ll use QuantConnect to test the strategy level approach.
Trading platforms drive me crazy! The biggest problem that I have as a trader is continuously reallocating capital across my portfolio. MetaTrader, NinjaTrader and the likes implicitly assume that I want to trade some percentage of my account balance on every trade. Either that, or that I trade fixed lots.
Trading that way is extremely inefficient. I’m trying to trade 40+ currencies, so I need to be able to decide which ones need the money for trading and which ones don’t have signals. Then, among the ones that do have signals, I need to dish out their allocations proportionately. The allocations aren’t the same for each instrument. If you know of any good FX platforms that meet this requirement, then let me know in the comments section.
Testing Pilum on its own is important. More important than the performance of Pilum is how that performance interacts with Dominari. That means taking the daily equity values of each currency. Does Dominari lose when Pilum wins and vice versa? Should I allocate capital 50-50 between the strategies or does one strategy deserve the lion’s share of the portfolio? Is one strategy so good that it should get all of the money?
The main concern with portfolio allocation is how it relates to leverage. Dominari historically make 96% annual returns, inclusive of trading costs. But, it’s also trading with leverage of roughly 19:1. It’s possible for markets to rip over stops and create significant losses.
USDCHF lost 40% of its value in one hour in January 2015. Say that the scenario was even more extreme and that nobody could place a trade during that time at any price. That 40% move is multiplied by the 19x leverage used. That’s a theoretical 800% loss; more than the money in the account.
Everyone loves leverage because they think of profits. Leveraging losses is a lot less exciting.
So, if you could earn 96% annual returns and only use 5:1 leverage, that is exponentially superior to earning 96% on 19:1 leverage. I need to compare the returns of Pilum to Dominari per unit of risk. That allows me to do cool things like
- Minimize the negative variance of the returns
- Increase absolute return
- Dynamically increase/decrease strategy allocations if I find patterns in their interactions
It’s a lower tech way of averaging strategies, like the litte guy’s version of what Numerai is doing… except that I have to create all of the strategies myself.
Quantilator
I spent the last few months sending surveys to segments of my subscribers asking how I can better serve you. Articles about indicators are overwhelmingly my most popular content. The trouble with that content is that I can’t complete the research fast enough to keep up.
The most valuable thing I’ve learned from the developing algorithms for the past 11 years is my process of deciding whether or not an indicator offers predictive value.

Say that you’re interested in gaps: do gaps predict future returns? What I normally do is code a gap indicator in R, implement my analysis methodology and give a verdict. My methodology is kind of like a system for building systems. Using my approach usually takes an hour for every new idea that comes along.
An hour is pretty short. An hour is REALLY short compared to when I didn’t have a research methodology. I used to waste months on junk strategies.
With Quantilator, I’ll be able to analyze anything in under 5 minutes. I’ll only have to follow 3 steps:
- Run a script in MT4 to export price data and indicator data
- Upload the exported data to Quantilator
- Analyze the results
This tool will be 100% free. I’m planning to go through the most popular indicators in MetaTrader to analyze whether or not they offer an edge. I’m building a library of small edges that can be combined into powerful strategies like Dominari and Pilum. And, in the spirit of open source, I plan to make that library available to you for free.
I’m writing this tool in Django, which is a Python framework for displaying web content. The initial version will do the analysis. I’m hoping to use this as an education tool. A bit of momentum can justify make it a fully fledged library with sample data, indicators and training videos and more.
Quantilator’s name comes from a key concept in my system analysis methodology; I break data into quantiles. These quantiles calculate average market returns for a given period of time. The quant in Quantilator refers to quantiles, but I really like the implied double entendre of making you a quant. After all, that is what I’m doing for you!
Update: The Quantilator is now freely available at http://q.onestepremoved.com/