Algorithmic and Mechanical Forex Strategies | OneStepRemoved

  • Articles
  • Sophisticated Web Sites
  • Automated Trading
  • Testimonials
  • Contact

Walk Forward Optimization

January 13, 2014 by Shaun Overton 6 Comments

If you were walking and randomly it started to rain, would you consider carrying an umbrella tomorrow? Of course you would.

The reason I ask a rhetorical question like that is when people observe a behavior, they respond accordingly. If they expect that something might happen again, they change their behavior to accommodate the change in outcomes.

When you think about forex robots, everybody has the dream of developing a strategy that works forever. It requires no changes. The initial settings always work. Turn it on and move to the beach.

Reality, of course, is more complicated than that.

walk forward optimization

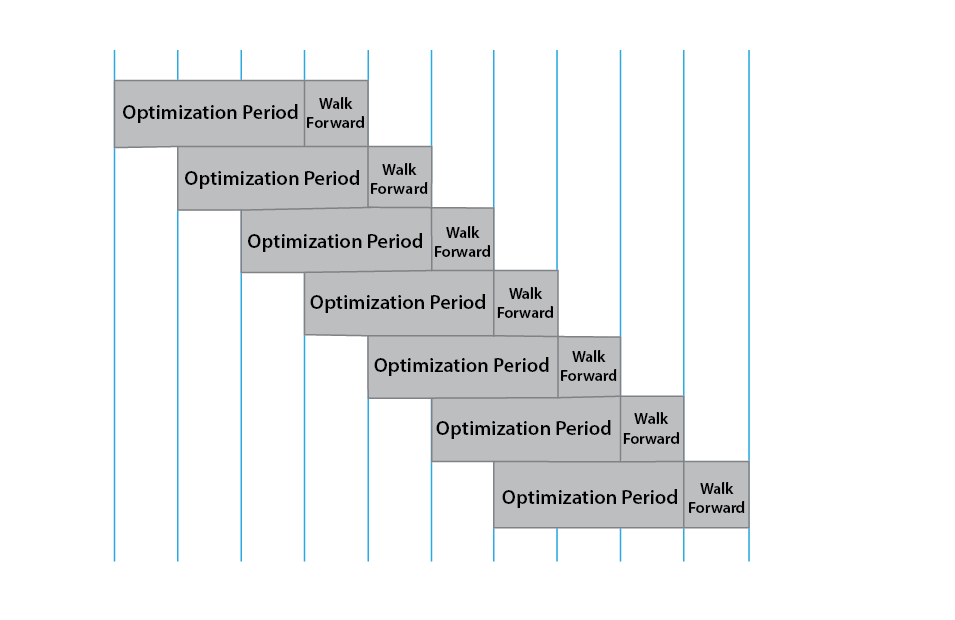
Walk forward optimization continually optimizes throughout time instead of looking for one set of static settings

That leads to expectations of what you need to do when your strategy inevitably goes awry. It’s very possible that you come up with a strategy that works and does amazingly well on the current market. However, a past genius doesn’t mean future genius. There’s always the chance that your strategy will no longer work in the future.

Why is that? It’s the same reason that you might carry an umbrella tomorrow if it rains today. People observe the market performing in a consistent manner. As more and more people make the observation, people start trading on it.  The market responds to those changes, and eventually the opportunity completely washes out as too many people have eared about it.

Walk forward testing is the process of determining whether or not your strategy has washed out. By testing on one set of data, and then testing it on a blind set, you can give yourself an indication of whether your strategy is bad or not. The goal of walk forward isn’t to prove that your strategy is good. It’s to prove that your strategy is not known to be bad.

The process of walk forward testing is very simple. You identify a set of information that you want to use for your testing and optimization. Using a real example, right now it’s the beginning of 2014. So maybe you want to look and test data from 2011 through 2012. That would be your in sample data, and then your out of sample data might be all of 2013.

In order to conduct a walk forward test, you would test and analyze your strategy 2011-2012. Then, to determine if it’s “not known to be bad”, you then walk forward to 2103 to see review the performance.

What you’ve done is a blind test. You didn’t know what how the strategy would perform in 2013 when you tested it in 2011-2012. By putting it on a blind sample, you give it the opportunity to fail.

The reason so many traders put their faith in walk forward testing is because it’s the absolute best tool to identify weaknesses in your optimization. When you’re testing a strategy, it is very likely that you’ve overfit to past opportunities.

Self feedback loops in the current market

Let me give you an example. In the current markets, a lot of traders have been banging gold on the market open where every day at market open., they sell as much gold as they possibly can. Sometimes it’s several multiples of the annual production in a span of a few minutes. What you see is an absolute freefall for five or ten minutes. That state persists for days at a time. But that doesn’t last forever. When enough traders start seeing that people bang gold on the open, they start doing the same thing.

Effectively, whoever wants gold to falloff on the market open has taught other traders to do that trade for them. As people expect gold to fall in the first five minutes of the open, they then change their behavior. Some try to jump on banging the open and go short.

Others start modifying their behavior. They notice that gold free falls for five minutes. Then, all of a sudden it stops, and more than like it reverts to the mean. They’ll start changing their tack and buying after so many minutes have elapsed from the open. They expect that the heavy volume that preceded the selling will eventually return to normal. As people change their behavior, other people respond in kind.

If enough people start selling on the open and then buying on the open five minutes later, you can see that a pattern is forming where one person responds to the actions of another. It’s a self feedback loop where the state that was working for the first couple of days no longer works in the future.

If you can identify a strategy that is able to survive those conditions, and is able to survive conditions where you didn’t do any testing and optimization, you give yourself better odds of succeeding in the future. It means that not very many traders have clued into this trading opportunity that you’ve discovered.

The approach to to walk forward testing is the antidote to the problem known as curve fitting. Curve fitting is the ultimate woulda coulda shoulda strategy.  It’s akin to opening a chart from yesterday and saying I would’ve bought here and I would’ve sold here, already knowing what transpired.

Of course you’re going to “make money” in that situation. You know with perfect information what the market did. In the future, you don’t know the perfect information. The goal of a strategy is to deal with that ambiguity.

Curve fitting means that you’ve fit everything so perfectly to past market conditions that when new situations inevitably arise, sort of akin to the phrase, “history doesn’t repeat itself, but it rhymes,” your strategy does the same thing.

You want a strategy that does well on past performance, but you’re not coming up with a strategy to make money on historical markets. The purpose of developing a strategy is to make money in future markets. When you’re backtesting, you’re trying to strike the balance between solid historical performance and, most importantly, making sure that that historical knowledge extrapolates to future performance. Your goal is to make money.

Rolling Walk Forward Optimization

Rolling walk forward optimization takes the walk forward idea and continuously improves the strategy by exposing it to new data. So let’s say that you have a twenty four month sample period. One way to go about it would be to optimize your strategy for a period of two months, then to walk it forward to the third month. You observe the behavior and you reoptimize for the second and third month, then walk it forward to the fourth month.

By doing so continuously, you eliminate the decay time of the strategy and give it a chance to adapt to ongoing market conditions. It is sort of the redheaded stepchild to machine learning. Experience and losses give the strategy the opportunity to improve and adjust to the market changes through walk forward optimization.

…you eliminate the decay time of the strategy and give it a chance to adapt to ongoing market conditions

Another important consideration for walk forward analysis is the degrees of freedom within a system. For example, let’s say that you are analyzing a moving averaage cross. You’re using two moving averages and use a fixed stoploss and take profit. That would give you four degrees freedom. The fast moving average is the first degree. The slow moving average is the second degree. The third is the stoploss and the fourth is the take profit.

The more degrees of freedom that you allow in a system vastly increases the chances 0f curve fitting your systems to historical data. The absolute best systems maintain twelve degrees of freedom or less. You want to find trading opportunities that have large numbers of trades and that offer performance that you find satisfactory.

Another element to consider in your optimization is what are you optimizing for.  Most people focus on the absolute return.  Returns are great, but most traders care much more about how they make their money instead of how much. Let me give you an example. If I had a system that made $25,000 last year, would you want it? Almost everybody says yes.

If I have a system that made $25,000 last year, but you had to lose to $15,000 before you made any money. Most people don’t want that system. What this means is that you care a lot more about the performance on a day-to-day basis rather than end result. The problem with optimization and even walk forward optimization is that you’re not necessarily focused on what you care about in the real world: the way that you’re making your money.

Most charting packages focused on the net outcome and that can cause some weaknesses in your system. If you’re range trading, what you’ve really done is cherry pick the results that are the least affected by substantial news. In effect, you’ve chosen the settings that have not yet been affected by fat tails.

If you’re trend trading, you’ve done the exact opposite. You intentionally pick the settings that maximize the fat tailes that have happened in the past. With trend trading strategies, you probably aren’t going to find consistent performance. Instead, what you’ll find is that the optimization frequently causes long, ongoing droughts of incessant drawdown. Then suddenly, almost out of nowhere, it finds a mega monster winner that returns several multiples of the drawdown that you experienced. This is fine for a hypothetical backtests, but in the real world where you’re suffering losses on a near daily basis, most traders can’t take the pain.  The weakness I find with most optimizations is that they don’t look at the consistency of performance. A potential substitute for optimizing a strategy would be looking at the linear regression of the equity curve over time. The best equity curve has the strongest linear regression slope.

Popular charting packages that implement rolling walk forward optimization are Amibroker, TradeStation, Multicharts and NinjaTrader.

Walk forward optimization in NinjaTrader

Open the Strategy Analyzer from the Control Center. Click File / New / Strategy Analyzer.

NinjaTrader Strategy Analyzer selection

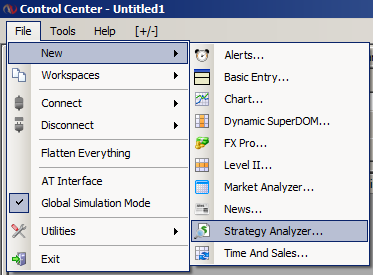
Open the strategy analyzer in NinjaTrader

  1. Left mouse click on an instrument or instrument list and right mouse click to bring up the right mouse click menu. Select the menu item Walk Forward. You can also click on the “w” icon in the Strategy Analyzer toolbar. If you prefer hot keys, you can also use CTRL + W. Lastly, you can also push the “W” icon at the top left of the Strategy Analyzer.
  2. Select a strategy from the Strategy slide out menu
  3. Set the Walk Forward properties (See the “Understanding Walk Forward properties” section below for property definitions) and press the OK button.
NinjaTrader Walk Forward Optimization

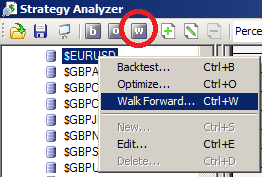
There are many ways to select walk forward optimization in NinjaTrader

The Walk Forward progress will be shown in the Status Bar of the Control Center.

Filed Under: NinjaTrader Tips, Test your concepts historically Tagged With: Amibroker, backtest, curve fitting, fat tails, gold, MultiCharts, ninjatrader, range trading, self feedback loop, short, strategy analyzer, TradeStation, trend, walk forward

Build a Trading Robot

April 10, 2013 by Shaun Overton 1 Comment

I talk a lot about the importance of building your trading plan. The same thing applies for building a trading robot or an expert advisor.

Most people approach EA development as digging frantically looking for huge gold nuggets. That approach is a good way to waste a lot of time and money.

Most people dive into the process without considering the details. The purpose of this post is to slow everything down so that you can develop some sort of business plan for your trading.

Steps to building a trading robot

Three long, difficult steps are involved with deploying a trading robot. You first need to obtain data for testing. A good strategy, once discovered, then needs to be programmed to automatically place trades. Finally, you need to select a broker to execute the orders in the live market.

The importance of data

A good number of traders brag about their best trades. One trade gave them a million dollar profit and other such and such.

What newbie system traders don’t realize is the tedious process of how these people reached their status. Knowing whether or not a system has an edge or not entails researching your idea using historical price data. Here are some tips that you can use when looking for data:

• You need to get data, you need to analyze it, and then you need to trade it. It is really simple on the surface, but when you are trying to go about this, every step creates huge obstacles. The easiest work around is to use the trading platforms listed at the bottom of the article.

• If you are looking for free options, you might go look somewhere like Yahoo! Finance where you can get data on lots of stuff that is mostly end of day prices. It’s no good for high frequency. You can get some options data, you can get forex and you can get some indices and some futures data.

• The reason why data quality is important is when we go on to analyze and come up with potential ways that you might want to trade algorithmically, if you have garbage data, you have a garbage analysis. Be very careful about the data that you decide to accept.

Problems gathering data

Now that we learned how important data is, we now discuss the other side of the picture in data gathering which is its disadvantages.

• Unreliable. Sometimes it’s just wrong. Sometimes there are duplicate entries. Sometimes there are gaps in the data that are unexplained. And if you don’t really know what you’re looking for, what kind of problems there might be in the data, you can come up with some weird discoveries.

• Delays. Technology bridges the information gap. But sometimes, due to time differences and the most annoying part when your broker or you are having problems on your internet connection at times, delays are inevitable.

• Clutter. There are a gazillion sources of information on the internet. This equates to a huge amount of data. Different brokers have their own set of websites and blogs which displays various analyses on a single instrument. It will now be a problem on what data will you consider credible and useful in your trade. Sometimes, analysts just anticipate most especially technical analysts posting price forecasts and so on. Those who waits for news like Unemployment rate has their own views on figures that will show up prior and during the announcement which basically creates clutter.

The Trading Platform

When you trade online, a trading platform is like your playing field. It is the software through which you manage your trades when you open, close or set limits or stops. Usually, a trading platform is provided by the broker.

There are platforms, APIs and all sorts of different companies that offer data and trading capabilities all in the same product. The advantage to those types of software is that it makes your life a lot easier because if you go about this on your own it’s a monumental task.

A lot of people that like to play with R, and you can just custom program your own research platform. Matlab and R are the most common tools in this category. The problem is that you have to build the trading components entirely on your own.

Here are some popular platforms MetaTrader, NinjaTrader, ThinkorSwim and Multicharts. All these platforms use their own different language and solve the data problem. They also include the ability to trade automatically. Most of the heavy lifting has already been done.

MetaTrader uses a custom language called MQL4, which is really a C Scripting Language. NinjaTrader uses C# .NET 3.5. Trade Station and Multicharts is a language called EasyLanguage, which for programmers will probably bore you to tears. To understand more about these platforms, you can check different brokers and their offerings.

Trading Platforms and data

We’ve covered the languages, the markets they cover and then, the other problem is really data. These platforms offer very different set-ups and they all handle the data problem differently.

MetaTrader

MetaTrader is kind of like the AK-47 of Trade Platforms. You download it and it doesn’t matter how novice or not good with computers you are. You will have a hard time not figuring out how to work the platform. It is simple, it’s very friendly. It’s also not sophisticated.

If you’re trying to do something sophisticated, that’s probably not the place to be. And for your analysis, you have to be very careful, because when you download MetaTrader, charts just pop up. You think, “Oh this is great, I got my data and everything looks good”, but the problem is that most of the time the data is junk. You can’t actually rely on it and do any serious analysis.

Getting the data and getting it formatted to MetaTrader is the most convoluted, difficult problem that traders face everyday. This is the platform that we deal with and everybody has problems with their backtesting and getting familiar.

This is good enough if you want to trade every couple of minutes and you’re not super execution sensitive and you are just trying to get something out cheaply. If you try every 4 hours and you trade 3 currencies, MetaTrader is fantastic for that.

But if you try to day trade or trade 20 different currencies at the same time, that’s a disaster, because MT4 isn’t multi-threaded. Every time you push an order into the market, MT4 can only handle it one at a time.

If you have 5 orders firing off together, this one has to finish, and you have all the latency in the middle where they connect and then bounce and the trade confirms okay. Now you repeat the process four more times to get all 5 trades filled. If you’re pushing too many orders through, MT4 will choke.

NinjaTrader

You have to find somebody to give you the data. There are some paid options, there are some, there’s one that’s free called Kinetick, and they give you end of day data. Brokerages also provide limited historical data. The quantity varies substantially from broker to broker.

The problem when you’re programming all this stuff and you’re trading in the live market, if you program to a broker specific platform, you probably spend 4 to 6 months developing and testing it and getting it working, and a lot of money and time. If you go to start trading live and you’re not happy with the broker, too bad. You married them.

What NinjaTrader did is, let’s say that there are Brokers A, B and C. NinjaTrader sits on top to bridge everything together.

NinjaTrader is an API shoved on top of multiple broker APIs so that you can write your strategy in NinjaTrader. They’ve done all the integration with every broker partner they have.

It’s a different way to handle the same problem as MetaTrader. MetaTrader just goes to these brokers and say “You should use our platform”. If you developed in MetaTrader, you can go switch on a whim.

If you have NinjaTrader, you can go switch on a whim. The difference is that you don’t just have NinjaTrader. You have to download the broker platform, then you download NinjaTrader. Then, you get everything hooked up and make sure everything plays nicely together.

There’s a steep learning curve with getting this all set-up to the point where you can actually download historical data and start trading with your broker. Once you have the data set-up, though, NinjaTrader is awesome.

TradeStation and Multicharts

TradeStation and Multicharts offer the same quality of analytics as NinjaTrader. They are easier to develop in. Obtaining data quickly makes these platforms easier for testing trading robots.

If you program with TradeStation, you trade with Trade Station. You can’t go trade with anybody else. However, if you’re ever unsatisfied with the broker because they slip you or because they charge bad commissions or whatever goes wrong with your trading, you don’t have any alternative. You’d have to move to MultiCharts or to redevelop the programming completely from scratch in another platform.

A trading robot

The Broker

Remember that your broker is your trading partner. It provides you the platform, data and most importantly the access in the market. Brokers are also service providers, and traders are their customers. It’s common for a customer to encounter some difficulties regarding the provider. There are two common reasons why a customer sometimes feels dissatisfied.

• First, bad service. When you are having difficulties opening your platform to execute a trade, you call on a customer service representative. And just like any other companies, a structured way of handling complaints will be given to you. Sometimes they can’t just give you what you need because they do not want to understand what you need.

• The second reason is bad execution. The broker is the market maker. They set the buying and selling prices at every single second. When you place a trade, they can present prices that are favorable to them. As a trader, when you know that the trend is on your side, sometimes you do not mind trading few pips higher or lower than your order. So you grab the offer. Until you realize that the broker made some hefty spread on your trades. This affects the trader emotionally and emotions should be out of trading. Emotions spoil strategies nut as a human being, it’s natural to feel upset.

Conclusion

Building your own trading robot is not as easy as ABC. It entails allot of effort in research, trying and testing trading signals and detaching every trade from your emotions. All of these steps are built on the foundation of your trading experience.

Remember that building a trading robot is anchored with the basic steps:
• Gathering and identifying the data you will use. Be very keen on what data to retain and what data will go directly to the bin. Not all data fed by your broker, articles written by analysts or data given to you by someone you know are reliable. Make sure to get the right data, analyze the data and trade using the data.

• A trading platform you are comfortable with. Before you start making your own trading robot, feel free to try different trading platforms. It’s like trying on some new pair of shoes before buying them. Do not go for something very complicated and you cannot even decode some basic functions. Remember that your platform is your playing field. It is more fun to trade through a platform you know how to operate than to get the most technical one and read through the help section while some other traders are gaining fast from a current trend.

• A reliable broker that will assist you on your trades. Your broker is your partner. It gives you data, platform and sometimes analysis in real time. Make sure to choose the broker that can give you what you demand and what you need.

If you will follow some of the above tips, you are on the right track on making your own trading robot.

Filed Under: Trading strategy ideas Tagged With: business plan, expert advisor, metatrader, MultiCharts, ninjatrader, TradeStation, trading robot

Trading Time in Programming

February 1, 2012 by Shaun Overton Leave a Comment

The major automated trading platforms such as MetaTrader 4, NinjaTrader and TradeStation all count time in the same way. This makes it quite convenient for ordering trading strategies and expert advisors; you don’t have to do any mental gymnastics to describe the strategy in different platforms. The consistent arrangement of time makes it easy for us to translate trading strategies across multiple platforms.

We tend to think of time as moving in the same direction as when we read. English speakers, who read from left to right, think of time as moving the same direction. If you speak a language like Arabic that reads right to left, you tend to think of time as marching to the left.

All of these charting platforms are written by speakers of left to right languages. The past is anything that’s not on the far right side. The present is the square on the far right. Each square represents an equal time interval. Traders know these as bars.

Time as an Array

A visual display of time and how it's segmented

What tends to confuse everyone ordering expert advisors is that even though time marches to the right, trading programmers count the bars to the left. What makes things more confusing is that programmers always start counting from 0 instead of 1.

How to count time in an array

Even though time moves to the right, we count it from the right and move back left

If you want to trade a moving average cross strategy that waits for the bars to close, what you’re looking at is “bar 2” and “bar 1”. The way I describe this in the scope of work is the value at two closed bars ago and the value at the last closed bar, respectively.

An expert advisor that uses closed bars ignores bar 0 because it is still open, which causes the moving average values to fluctuate. The only way to know for certain a moving average value at a particular bar is to wait for the bar to close, which means it is no longer bar 0. When a client requests an expert advisor that trades intrabar, they intend to compare the moving averages at “bar 1” with “bar 0”. In plain language, that means to compare the value at the last closed bar with the currently open bar.

Hopefully, this description makes sense when you open a chart and see the bars already loaded. The final confusing element is when a new bar pops onto the screen. The previous examples showed 5 bars on the chart (bars 0-4). When a sixth bar pops up, the count is reset to the new time period on every update.

Say that we’re looking at an H1 chart in MetaTrader and that the current time is 06:00. When the new hour strikes, the chart loads a new candle to represent 07:00. It’s at this time that the count resets.

Time udpates

When a new bar appears, your charting platform resets the count based on the newest bar.

Filed Under: MetaTrader Tips, NinjaTrader Tips, Trading strategy ideas Tagged With: expert advisor, intrabar, metatrader, moving average crossover, ninjatrader, programmer, scope of work, time, TradeStation

FREE trading strategies by email

Trending

Sorry. No data so far.

Archives

  • Dominari
  • How does the forex market work?
  • Indicators
  • MetaTrader Tips
  • MQL (for nerds)
  • NinjaTrader Tips
  • Pilum
  • QB Pro
  • Stop losing money
  • Test your concepts historically
  • Trading strategy ideas
  • Uncategorized
  • What's happening in the current markets?

Translation


Free Trading Strategies

Privacy PolicyRisk Disclosure

Copyright © 2023 OneStepRemoved.com, Inc. All Rights Reserved.