Implied volatility is, or at least should be, a key factor in every trading strategy. In the past two articles we learned how to use implied volatility through the highly watched VIX index. We also learned that the VIX is a great tool to gauge when a range is about to be broken. And especially as it relates to the FX market, it can suggest when momentum is about to accelerate. But what about as it pertains to, say, the Nasdaq 100 or commodities? Can, or maybe more accurately, should you use the VIX as a barometer for those as well?
It’s an Asset on to its Own
Naturally, because the VIX measures such a broad variety of stocks, it’s a great tool both on and off risk. Yet as can clearly be seen in the correlation chart below, the VIX can’t work all the time. The concept behind correlation is simple; whether positive or negative, there are instruments (S&P500, Gold, etc.) that can be compared. The key is that the instruments or assets must move either in tandem or its inverse and the closer to 1 (or -1), then the closer the correlation of their movement. Even a -0.3% means there is some degree of correlation between the instruments or assets.
But what if the correlation is 0%? That’s bad news! This means that, at that particular time, you are in a dead zone. At 0%, the assets are not moving in tandem but moving as if they are not related at all. In such cases, a “crude” indicator of risk on risk off such as the VIX simply can’t help you. If you trade in the mid to long term, eventually that correlation will come back. If you’re worried about the next two or three days or even a week, well, then you might be in trouble.
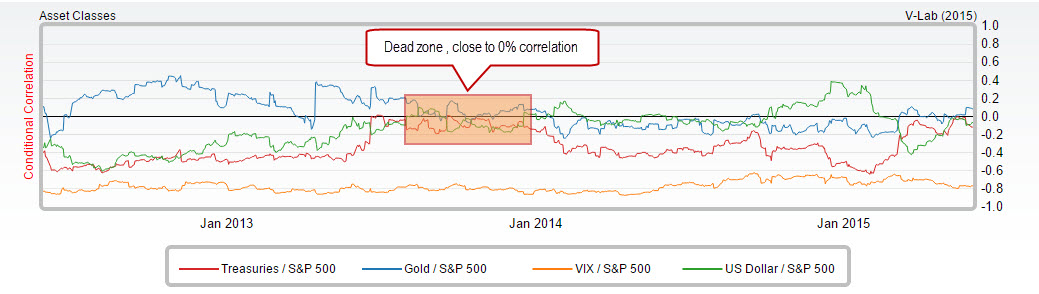 Source: V-Lab
Alternatives to VIX
Not all assets are moving exactly in tandem and as I just explained sometimes the VIX is too “crude” for surgical precision and you need to find something more indicative for your specific trade. The possible solution? A designated VIX indicator for each asset class. The possible problem? Not all VIX indicators are made equal.
There are several VIX indicators, five of which are major, the others less so. First, of course, is the VIX on equities, then the VIX on commodities, and last the VIX on bonds. There is also a VIX on interest rates but that is likely less relevant to the average trader. And, of course, there are various VIX indicators on currencies, which you can learn more about through my past analyses on FX volatility.
When it comes to equities beyond the VIX (which measures implied volatility on the S&P500) there is the VXN, which measures the NASDAQ 100’s volatility, and the VXD, which measures volatility on the Dow Jones Industrial Average. If you regularly trade Apple, Amazon or Google then you’ll be happy to know that each has its own VIX (respectively, VXAPL, VXAZN and VXGOG). These VIX alternatives provide more precise timing of breakouts and fallouts for traders of other major indices or the big tech stock. As seen in the chart below, the VXAPL or Apple VIX is an accurate barometer for potential Apple breakouts.
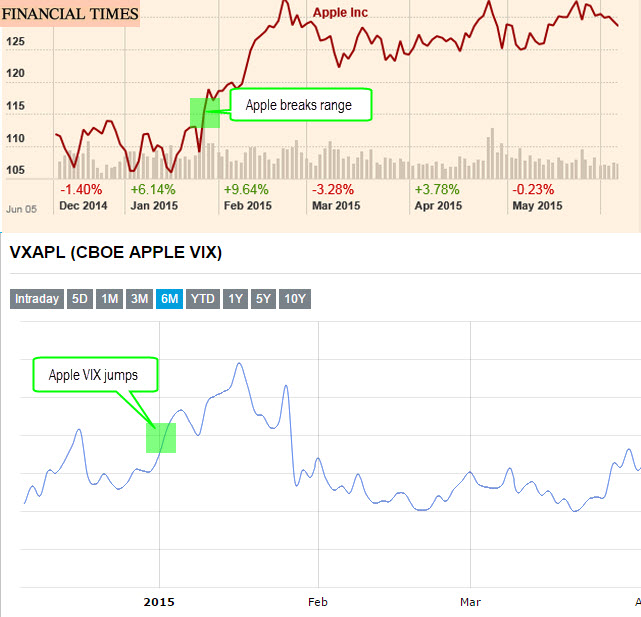
Source: Financial Times & CBOE
Implied Volatility with Commodities
Implied volatility in equities, and to some extent in FX, is considered a contrarian strategy whereby implied volatility at record lows suggests volatility is about to soar higher and vice versa. In commodities, however, the strategy works somewhat differently. Implied volatility could be viewed more as an indicator of the force of inflows and outflows of Oil, Gold or Silver (each having its own corresponding VIX).
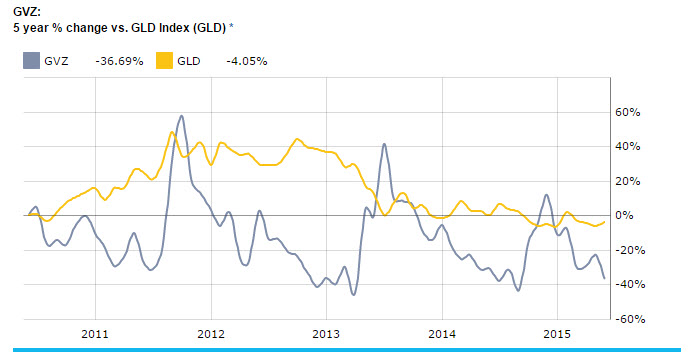
As seen in the GVZ index below, the trend on Gold volatility as compared to price suggests that as implied volatility slides, interest in the metal also falls. And, to the contrary, if the GVZ bottoms out that could point to a renewed interest in the metal. What it all boils down to is that while implied volatility in equities and FX is a contrarian index, in commodities, it’s a trending one.
Unlike equities and currencies, with commodities it’s not a case of zones, or of lows or highs of implied volatility; rather, it’s a case of trajectory. While implied volatility is a great timing tool in equities or FX (given its cyclical nature), with commodities implied volatility tends not to be as sensitive and lacks the smoothness of the others. The pros: The GVZ indicator can still be very useful when interest among investors is growing and can help figure out long term trends. The cons: It’s only good for the long term.
 Source: CBOE
Leave a Reply