算法和机械的外汇策略 | OneStepRemoved

  • Articles
  • Sophisticated Web Sites
  • 自动交易
  • 褒奖
  • 联系

How to Trade the GBP after Brexit

七月 12, 2016 由 Lior 衣柜 2 评论

The selloff in GBP pairs after Brexit presents a challenge for a trader. 乍一看, the strategy for the key GBP pairs, mainly that of the GBP/USD and GBP/JPY, should be simple. The GBP is in vertical short, falling almost in a horizontal line; 因此, the trader should apply a vertical short strategy. But when it comes to the GBP, and for that matter, any pair trading at multi-decade lows, the game plan should be slightly different. So without further ado, here are some tips to trade the GBP after Brexit and any pair that is under its historical lows.

英镑: Two Risks

In the aftermath of the GBP Brexit meltdown, GBP pairs, such as the GBP/USD, have two major risks that we have to navigate around – direction and momentum.

Direction – Since we are talking about multi-year lows, we cannot know when the bottom will emerge, because the pair is in uncharted territory.

Momentum – Again, we have no way of knowing when the momentum will change from vertical bearish movement to a trend to a possible range bound.

So how do we handle those unknowns? We use strategies that minimize the risk from the elements.

Buy on Hammer Reversal

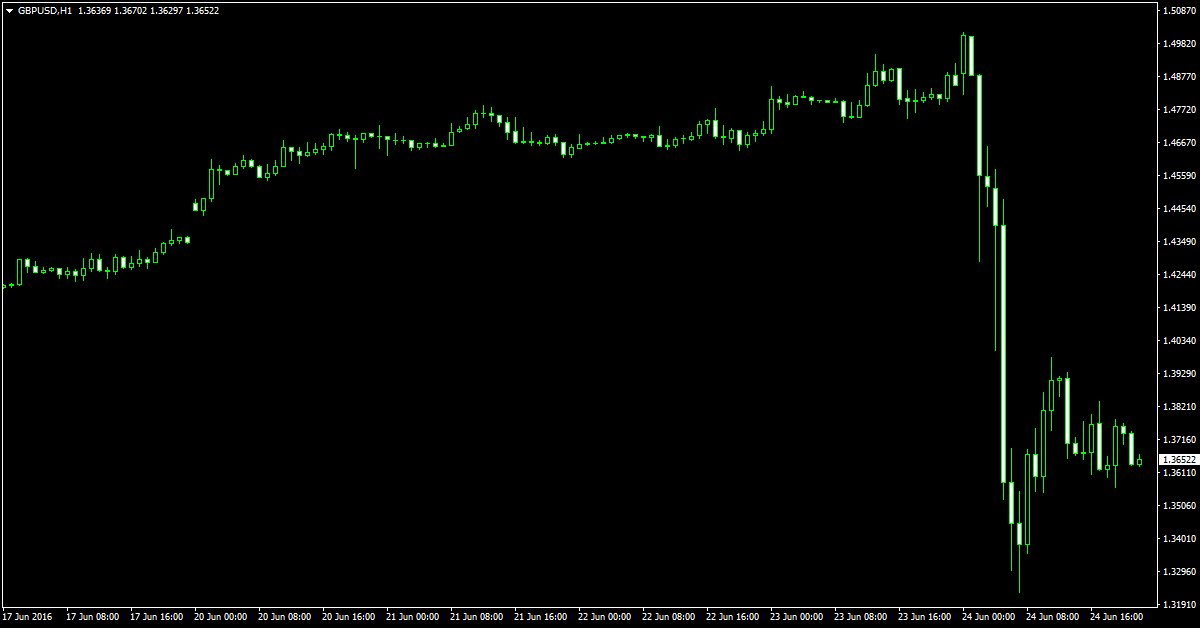
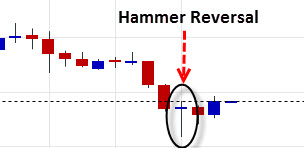
As we can see in the chart below, and as is common when a vertical short occurs, after the vertical short comes a brief bounce. What indicates that that bounce is coming is a hammer reversal candle. A hammer reversal candle is a candle where the middle is long and the opening price and closing price are very close. Once we get a hammer reversal candle we can expect a small bounce.

To increase our confidence in an upcoming bounce we can and should combine a MACD indicator. If the MACD indicator suggests weakening momentum, we get a confirmation. Once we get our confirmation it is a signal to buy; our limit should be set below the opening price of the first full bearish candle of the latest vertical short.

英镑

Why should we use this strategy? When we have no indication as to when the pair will bottom out, it’s hard to take a short without risking a sudden bounce back. 通常, it’s less advisable to trade but, under the current conditions, this pattern gives us a chance to reduce the risk of the unknown and minimize the time we are exposed to a choppy market.

Sell on a Major Pull Back

At some stage, every short, no matter how strong, gets a major pull back. That will be our first real opportunity for a short entry. Once we get a major reversal, and by major I mean at least 38.2% of a Fibonacci retracement, then we will get our opportunity to short. That’s because no bearish trend ends without at least two attempts at the same low. That means that, at such a stage, we are no longer in an unknown and our target is the pair’s lowest point.

It’s important to note that when a pair experiences a major retracement it usually signals the end of a vertical short movement and thus is a signal for us to stop using our hammer reversal strategy.

Our limit is now known, aka the low of the pair. And our signal to short can be varied, as in trading a short under any other circumstance. Oscillators such as the MACD, 平均真实范围 and the Stochastic Oscillator can help us time the resumption of the bearish momentum and ride the bearish wave.

But what’s important to understand here is that after a major retracement, it’s much safer to start trading on a longer term and ride a bearish wave.

结论

Although those insights have been implemented on the latest meltdown in GBP pairs, the tactics we learned here are not only useful for the GBP but can prepare you for the next FX pair meltdown, whether it’s the Euro pairs or the Brazilian Real pairs. What those tactics teach you is how to trade a rather risky situation with plenty of uncertainty. 肯定, it is still risky to trade a currency in a meltdown, but at least, with the tactics above, you can avoid the major pitfalls.

提起下: 这是怎么回事,在当前的市场? 标记: Brexit, 烛台图表, 斐波那契, 英镑兑美元, 锤, 振荡器, 回撤

Flat and happy

六月 24, 2016 由 肖恩·奥弗顿 发表评论

This is the first financial event since 2008 that’s hit the mainstream public. Even my friends from college are talking about the Brexit on Facebook.

My Dominari system only trades during the UK evening, so I felt comfortable leaving my system on overnight. When I woke up, 然而, I didn’t feel the same. Did you see the GBPUSD chart? Holy cow! 1,300 pips in an hour.

Brexit

GBPUSD lost more than 1,790 pips in a day from top to bottom on the Brexit.

This is the first time I’ve intervened in a trading system since April of last year. What makes me very happy, 虽然, is that this intervention is all about protecting profits. I’m up 6.69% since I began trading the finalized version of Dominari on April 15.

Dominari equity curve

My equity curve as of June 24, 2016.

myfxbook.com/members/QuantBar/dominari-pepperstone/1591822 – my results at Pepperstone

Dominari isn’t intended to trade these types of markets. 所以, instead of deciding to “see what happens”, I’m flat and happy until we see how the markets open after the weekend. I expect big gaps. I don’t feel like gambling which way the gaps may go.

If you clicked the original link, you noticed that the equity curve is marching straight up. That’s what’s supposed to happen. But like any good system trader, I wanted to see it working in the real world before I upped the capital commitment.

本月初, I decided to trade a second account at FXCM, this time in USD. That brings my total accounts to €8,500 and $5,100. That’s about $14,600 in USD terms between the two accounts.

The FXCM account started live trading on June 6. Before then, I made sure to test it on an FXCM demo account to confirm that my edge wasn’t completely dependent upon broker selection. I’m happy to report that the FXCM results are closely mirroring those at Pepperstone.

myfxbook.com/members/QuantBar/dominari-fxcm-mt4/1679763 – my results at FXCM.

提起下: 规则 标记: Brexit, 福汇, 英镑兑美元, 辣椒音

QB Pro 更新 9 月 2015

十月 1, 2015 由 肖恩·奥弗顿 6 评论

回到黑暗中! 月回报率 1.03%. 它不是一个庞大的收益, 我承认, 但胜利就是胜利.

QB Pro lifetime Oct 2 2015

The lifetime equity for QB Pro

Performance didn’t really go anywhere this month. We floated 2% above and 2% below zero most of the time.

QB Pro Sept 2015 公平

The QB Pro performance for September 2015 只

QB Yen came in again at a minor loss -0.61%.

qb yen equity 201509

The performance for QB Yen only, Sept. 2015

I’m a bit disappointed with the QB Yen performance so far. Nothing seems wrong other than bad timing turning it on on my part. It’s still hard to take it on the chin for 5 months running, 虽然.

The hedge

I manually hedged the portfolio earlier this month by buying USDCNH in a pullback from of all the chaos. The portfolio took it hard when the yuan was loosened up. I figured that any further volatility would likely stem from USDCNH weakness.

The Chinese are actively intervening in their currency. As we all know from the GBP in the 1990s and the CHF this year, interventions work until they don’t. The main point of concern for me is the rollover cost. It is quite expensive to maintain the position.

The thing that makes me comfortable with that trade is that there is no chance of China miraculously healing. It’s in debt up to its eyeballs – everything from corporates all the way up to regional governments. And while China doesn’t want the yuan to devalue too quickly, the absolute last thing it would want is for the yuan to rise in value.

I cannot conceive of any plausible scenario where China manages to return to the 7-10% annual GDP growth that it experienced for 30 岁月. Too hot, too fast. If you have a plausible scenario in mind, then write your ideas in the comments section.

Updates to the strategy

I’ve promised many updates to the strategy over the past 6 个月. Jingwei and I have evaluated them all. All of the proposed changes came up far short of my expectations and were thus not implemented in the live account.

I’m working with Jingwei, our actuary, to develop new trading systems. You’re going to learn the newest indicator in a few months.

发布者 OneStepRemoved.com 上 星期四, 九月 17, 2015

The changes alluded to in the post are all different from QB Pro. I’ve flogged that strategy about as much as I can.

I feel good about QB Pro long term. Before anything potentially good happens in the account, 然而, I really need the Fed to get off the bench. Raising rates would be good for us because it should kick off a long term USD trend. Another round of QE would be the best thing for the strategy. I personally despise QE and think it’s a bad idea, but it would ignite a massive USD selloff. That’s the kind of market where QB Pro has done extraordinarily well in the past.

Here’s the US dollar index for the past year:

US dollar index 365 天

The US dollar index for the past year.

And for easy comparison, here’s the same QB Pro lifetime equity chart. Notice that performance peaked around mid-March and has been flat ever since.

QB Pro lifetime Oct 2 2015

The lifetime equity for QB Pro

Things should pick back up whenever the dollar picks a direction. I expect that to happen by year’s end. Nobody will believe the Fed if they punt one more time on a rate increase in December.

同时, all of this research has given me the great epiphany that the strategy works best where pairs are trending. The portfolio is being rebalanced this month accordingly.

提起下: QB临 标记: 中国, 欧元兑瑞郎, 美国联邦储备, 英镑兑美元, 利率, Quantitative Easing, Yuan

有效的趋势线导航

六月 24, 2015 由 理查德错误 发表评论

与几乎任何的交易场景中一样, 我们必须首先确定我们需要贸易的对成功的最大可能性的方向.

By looking at the historical 4 hour chart of the GBPUSD below, there are several reasons we know that we want to go long (购买) 这一对. Price action is above the 200 Simple Moving Average and is pulling away from it. The pair has been making higher highs (green lines) and higher lows which indicates an uptrend. 还, 在此图表的时间, the GBP was 该 strongest currency and the USD was one of the weaker currencies.

All these point to a buying opportunity.

但, the question remains, when do we enter the trade?

Here’s where we bring in the trendline…

Screen Shot 2013-06-24 在 2.58.57 PM

Let’s take a look at the historical 4 hour chart of the GBPUSD pair below…
趋势线 1


We can see that price action has come in contact with trendline support at several points – note the blue boxes.

Since price has tested and respected the trendline for at least three “touches”, we know that our trendline is valid.

Our entry strategy to buy this pair using trendline support will be to wait for price to trade down to the trendline and into the “Buy Zone”. If price trades into the Buy Zone and stalls and a candle does not close below trendline support, just as in our blue box examples, we can take a long position on the pair with our stop just below the trendline or just below the lowest wick that penetrates the trendline.

The trader could exit the trade if price reaches resistance, the previous high, or by employing a simple 1:2 Risk Reward Ratio.

Now let’s take a look at a historical 4 hour chart of the USDCHF for an example of selling against Trendline Resistance in a downtrend…

趋势线 2

This trading scenario will be virtually the opposite of what we did in the previous buy example.

We want to sell the pair a it has been making lower lows (red lines) and lower highs. Price action is below the 200 SMA and pulling away from it. 还, 在此图表的时间, the USD was weak and the CHF was strong.

再次, price action has tested our resistance line at several points (the blue boxes) so we know the trendline to be valid. In this example we would wait for price to trade up to trendline resistance in the “Sell Zone”. As long as a candle does not close above the trendline, we would sell the pair with a stop just above the trendline or just above the highest wick to penetrate the trendline.

The trade could be closed should price reach the previous low or we could use a 1:2 Risk Reward Ratio to exit the trade.


RKrivoFX@gmail.com

RKrivoFX

提起下: 如何在外汇市场工作? 标记: 确定趋势方向, 英镑兑美元, 风险回报率, 趋势, 趋势线, 美元兑瑞郎

黄牛EA其他双

三月 26, 2013 由 肖恩·奥弗顿 发表评论

许多读者正在使用 黄牛EA 住账户. 最重要的问题,其中许多人提到的是,我的研究只集中在欧元兑美元. 它在其他外汇人一组?

绝对. 然而, 它不会对所有的人工作. 走这解释了为什么专家顾问的工作这么好,欧元兑美元相同的逻辑过程是很重要的.

分析Excel图表的黄牛EA

我们必须深入回Excel以评估原假设. 我的期望是,战略应该在图表那里的价格从距离 200 SMA通过曲线形成了一个很好的中间拐点.

GPBUSD price & 中学 200 distance frequency for the scalper EA

的价格从不同距离的频率 200 SMA英镑兑美元上.

该地区对周围的 0.5% 标志着拐点. 在此提醒, 你能想到的曲线为两部分所组成. 有陡峭的部分, 这是那里的价格是非常有可能的举动. 再有就是平坦部分. 这意味着价格的漂移动作,而不是.

想想斜率为变化率. 陡峭的斜率意味着变化的速度快. 价格可能会在下一栏的任何地方,但这里.

平坦的山坡做出变革的速度缓慢. 价格其实很可能仍来自SMA在未来条类似的距离.

Slope of frequency of price and SMA 200 distances.

图形包含 2 斜坡. 陡峭的坡度和坡平. 它们都标记为红色.

该策略只能在价格很可能保持在同一地点. 我们是, 毕竟, 倒票. 机会只存在当专家顾问可以在交易印章. 印章只存在时的频率线的斜率是平坦的.

我用我的经验,欧元兑美元推断 0.75% 将使一个自然起点,以评估对移动平均信封. 这是远不够从转折点克服扩散成本, 但足够接近,产生的交易机会了坚实的数.

初步结果出来了,甚至比欧元兑美元更. 这些结果不包括打滑, 佣金或传播成本.

GBPUSD结果

结果 2011 对英镑兑美元的黄牛EA

结果 2011 对英镑兑美元的黄牛EA

结果是非常符合最初的想法. %的精度住在同一个球场, 走出来 81%. 利润的因素跃升非常漂亮,以 2.99, 这大大超过了欧元兑美元的表现更好 2.16. 样本大小由 113 行业, 这足以推断性能的合理预期.

英镑兑美元上了黄牛EA的股权曲线 2011.

英镑兑美元上了黄牛EA的股权曲线 2011.

最终的测试是 “它包括交易成本时赚钱?” 答案是肯定的. 在 2.5 点差, 标准手的总交易成本 113 交易为$ 25 /很多 * 113 很多 (行业) = $2,825. 这个数字是比原始利润基本上较少 $5,360. 这是有道理的贸易这一战略.

向前走的最后一步遗憾的是并没有提供足够的数据点,以得出一个结论. 它只是摆 13 行业全年. 它打破了连.

美元兑加元倒卖统计

EA scalper, 美元兑加元, 0.9% banwidth

美元兑加元的表现 2011 同的频带 0.9%.

美元兑加元的资金曲线 2011, EA Scalper

美元兑加元的资金曲线 2011

美元兑日元是一个坏主意

频率曲线图美元兑日元看起来更, 比其他货币太大的不同. 而不是被陡峭而大多持平, 它更像是自由下落,并完全平坦. 尾部的巨大规模和陡峭和平坦部分之间的严重反差使我相信, 正确地, 该交易美元兑日元将不会是一个好主意.

的价格从不同距离的频率 200 SMA对USDJPY.

的价格从不同距离的频率 200 SMA对USDJPY.

虽然邻近的拐点的区域都是确实最有利可图, 对于美元兑日元的利润因素骤降至略高于 1.0. 当交易成本的因素, 它没有意义的交易.

Scalper EA USDJPY 2011

在黄牛EA对美元兑日元的贸易表现 2011

关联

你读过的文章,解释如何以及为什么 黄牛EA 作品?

如果您对如何使这些规则适用于更多的货币对或工具的任何建议, 那么请您分享在下面的评论部分.

提起下: 交易策略的想法 标记: 欧元兑美元, 专家顾问, 英镑兑美元, 黄牛, 倒票, 美元兑加元, 美元兑日元

通过电子邮件免费交易策略

趋势

抱歉. No data so far.

档案

  • 规则
  • 如何在外汇市场工作?
  • 指标
  • MetaTrader的提示
  • MQL (书呆子)
  • NinjaTrader提示
  • Pilum
  • QB临
  • 停止赔钱
  • 历史上测试你的概念
  • 交易策略的想法
  • 未分类
  • 这是怎么回事,在当前的市场?

翻译

EnglishEnglish
中文(简体)中文(简体)
DeutschDeutsch
日本語日本語
Bahasa MelayuBahasa Melayu
PortuguêsPortuguês
EspañolEspañol
由 Transposh - translation plugin for wordpress

免费交易策略

隐私政策Risk Disclosure

版权 © 2019 OneStepRemoved.com, 公司. 版权所有.